
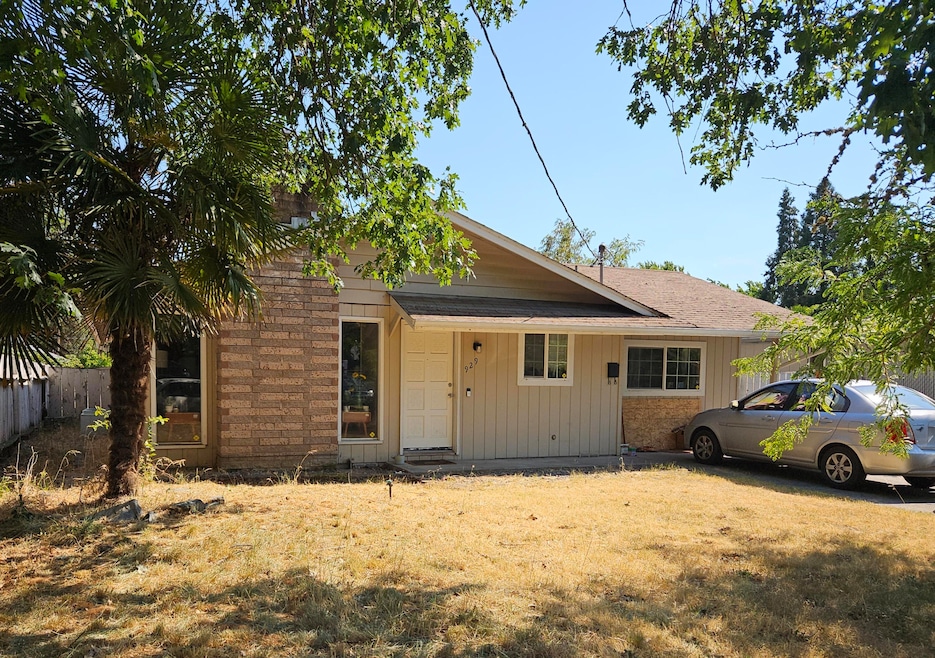
929 SW H St Grants Pass, OR 97526
Estimated payment $1,867/month
Total Views
2,563
3
Beds
1.5
Baths
1,462
Sq Ft
$211
Price per Sq Ft
Highlights
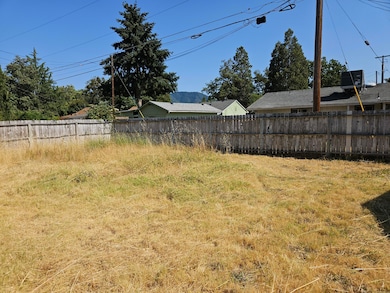
- Territorial View
- No HOA
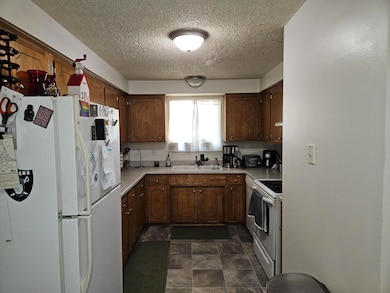
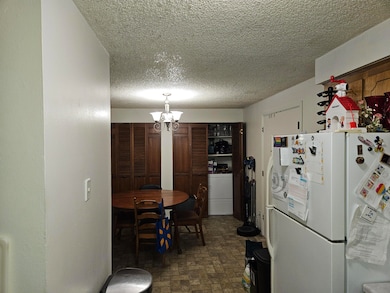
- Eat-In Kitchen
- Traditional Architecture
- Covered Patio or Porch
- 3-minute walk to Stansfield Park
About This Home
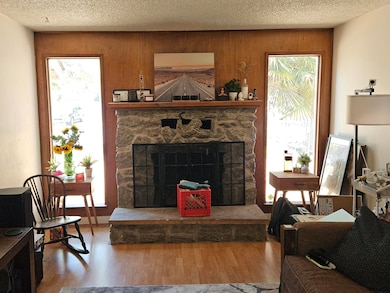
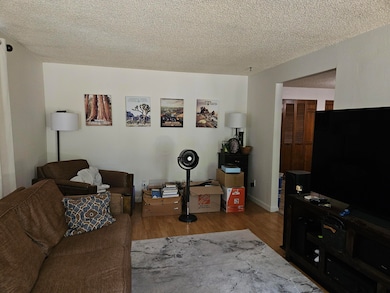
A 3‑bed, 1.5‑bath home with a converted garage offering extra living, office, or family room space. Home is just under 1500 sq ft, and is at the end of street. The large fenced back yard invites gardening and landscaping customization. Covered concrete patio offers great space to relax or BBQ. Great proximity to schools, parks, downtown, and restaurants. Newer windows, and fireplace in living room. Buyers to perform due diligence regarding home. Information provided intended to be accurate and reliable.
Listing Agent
John L Scott Real Estate Grants Pass Brokerage Phone: 541-476-1299 License #201207999 Listed on: 07/17/2025
Home Details
Home Type
- Single Family
Est. Annual Taxes
- $2,239
Year Built
- Built in 1970
Lot Details
- 5,663 Sq Ft Lot
- Fenced
- Level Lot
- Property is zoned R-2; Res Mod Density, R-2; Res Mod Density
Property Views
- Territorial
- Neighborhood
Home Design
- Traditional Architecture
- Frame Construction
- Composition Roof
- Concrete Perimeter Foundation
Interior Spaces
- 1,462 Sq Ft Home
- 1-Story Property
- Wood Burning Fireplace
- Double Pane Windows
- Family Room
- Living Room with Fireplace
- Laundry Room
Kitchen
- Eat-In Kitchen
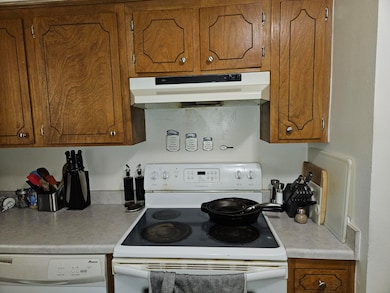
- Oven
- Range
- Dishwasher
Flooring
- Carpet
- Laminate
- Vinyl
Bedrooms and Bathrooms
- 3 Bedrooms
- Linen Closet
Home Security
- Carbon Monoxide Detectors
- Fire and Smoke Detector
Parking
- Driveway
- On-Street Parking
Outdoor Features
- Covered Patio or Porch
- Outdoor Storage
- Storage Shed
Schools
- Parkside Elementary School
- North Middle School
- Grants Pass High School
Utilities
- Forced Air Heating and Cooling System
- Space Heater
- Heating System Uses Natural Gas
- Heat Pump System
- Natural Gas Connected
- Water Heater
Community Details
- No Home Owners Association
Listing and Financial Details
- Exclusions: Washer/Dryer, personal prop
- Legal Lot and Block 4800 / C
- Assessor Parcel Number R311826
Map
Create a Home Valuation Report for This Property
The Home Valuation Report is an in-depth analysis detailing your home's value as well as a comparison with similar homes in the area
Home Values in the Area
Average Home Value in this Area
Tax History
| Year | Tax Paid | Tax Assessment Tax Assessment Total Assessment is a certain percentage of the fair market value that is determined by local assessors to be the total taxable value of land and additions on the property. | Land | Improvement |
|---|---|---|---|---|
| 2024 | $2,239 | $167,390 | -- | -- |
| 2023 | $2,109 | $162,520 | $0 | $0 |
| 2022 | $2,119 | $157,790 | -- | -- |
| 2021 | $1,990 | $153,200 | $0 | $0 |
| 2020 | $1,933 | $148,740 | $0 | $0 |
| 2019 | $1,877 | $144,410 | $0 | $0 |
| 2018 | $1,910 | $140,210 | $0 | $0 |
| 2017 | $1,896 | $136,130 | $0 | $0 |
| 2016 | $1,666 | $132,170 | $0 | $0 |
| 2015 | $1,588 | $128,330 | $0 | $0 |
| 2014 | $1,538 | $124,600 | $0 | $0 |
Source: Public Records
Property History
| Date | Event | Price | Change | Sq Ft Price |
|---|---|---|---|---|
| 08/05/2025 08/05/25 | Price Changed | $309,000 | -3.1% | $211 / Sq Ft |
| 07/17/2025 07/17/25 | For Sale | $319,000 | -- | $218 / Sq Ft |
Source: Oregon Datashare
Purchase History
| Date | Type | Sale Price | Title Company |
|---|---|---|---|
| Bargain Sale Deed | -- | None Available | |
| Special Warranty Deed | $85,000 | Ticor Title Company Oregon | |
| Trustee Deed | $162,201 | None Available | |
| Warranty Deed | $189,000 | First American | |
| Interfamily Deed Transfer | $189,000 | First American Title | |
| Trustee Deed | $117,421 | -- |
Source: Public Records
Mortgage History
| Date | Status | Loan Amount | Loan Type |
|---|---|---|---|
| Previous Owner | $37,800 | Stand Alone Second | |
| Previous Owner | $151,200 | New Conventional |
Source: Public Records
Similar Homes in Grants Pass, OR
Source: Oregon Datashare
MLS Number: 220205966
APN: R311826
Disclaimer: Certain information contained herein is derived from information provided by parties other than Homes.com. All information provided is deemed reliable, but is not guaranteed to be accurate and should be independently verified.
![]() © 2025 Oregon Datashare (KCAR | MLSCO | SOMLS). All rights reserved. The data relating to real estate for sale on this web site comes in part from the Internet Data Exchange Program of the Oregon Datashare. Real estate listings held by IDX Brokerage firms other than Ten-X are marked with the Internet Data Exchange logo or the Internet Data Exchange thumbnail logo and detailed information about them includes the name of the listing Brokers. Information provided is for consumers' personal, non-commercial use and may not be used for any purpose other than to identify prospective properties the viewer may be interested in purchasing. The consumer will not copy, retransmit nor redistribute any of the content from this website. Information provided is deemed reliable, but not guaranteed.
© 2025 Oregon Datashare (KCAR | MLSCO | SOMLS). All rights reserved. The data relating to real estate for sale on this web site comes in part from the Internet Data Exchange Program of the Oregon Datashare. Real estate listings held by IDX Brokerage firms other than Ten-X are marked with the Internet Data Exchange logo or the Internet Data Exchange thumbnail logo and detailed information about them includes the name of the listing Brokers. Information provided is for consumers' personal, non-commercial use and may not be used for any purpose other than to identify prospective properties the viewer may be interested in purchasing. The consumer will not copy, retransmit nor redistribute any of the content from this website. Information provided is deemed reliable, but not guaranteed.
Nearby Homes
- 951 SW H St
- 1011 SW I St
- 207 SW Oak St
- 1000 SW K St
- 1041 SW J St
- 905 SW K St
- 1013 SW L St
- 927 SW L St
- 47 SW Eastern Ave Unit 5,6,7
- 47 SW Eastern Ave Unit 8
- 53 SW Eastern Ave Unit 53, 55
- 708 SW Bridge St
- 310 SW J St
- 508 NW E St Unit A,B,C
- 229 SW J St
- 416 NW Booth St
- 811 SW 4th St
- 1535 SW Foundry St
- 1617 SW Jordan St
- 936 SW Greenwood Ave
- 1132 SW Rogue River Ave
- 1119 SE N St
- 1135 NE D St
- 719 NE 10th St
- 717 NE 10th St
- 1520 Molly Ln
- 281 Glen Dr
- 1051 E Park St
- 1100 Fruitdale Dr
- 1465 NE 10th St
- 1841 NE D St
- 1103 SE Excalibur Dr Unit Excalibur
- 459 4th Ave
- 370 S 5th St
- 556 G St
- 700 N Haskell St
- 2642 W Main St
- 1372 Glengrove Ave
- 835 Overcup St
- 301 N Columbus Ave Unit 301.5