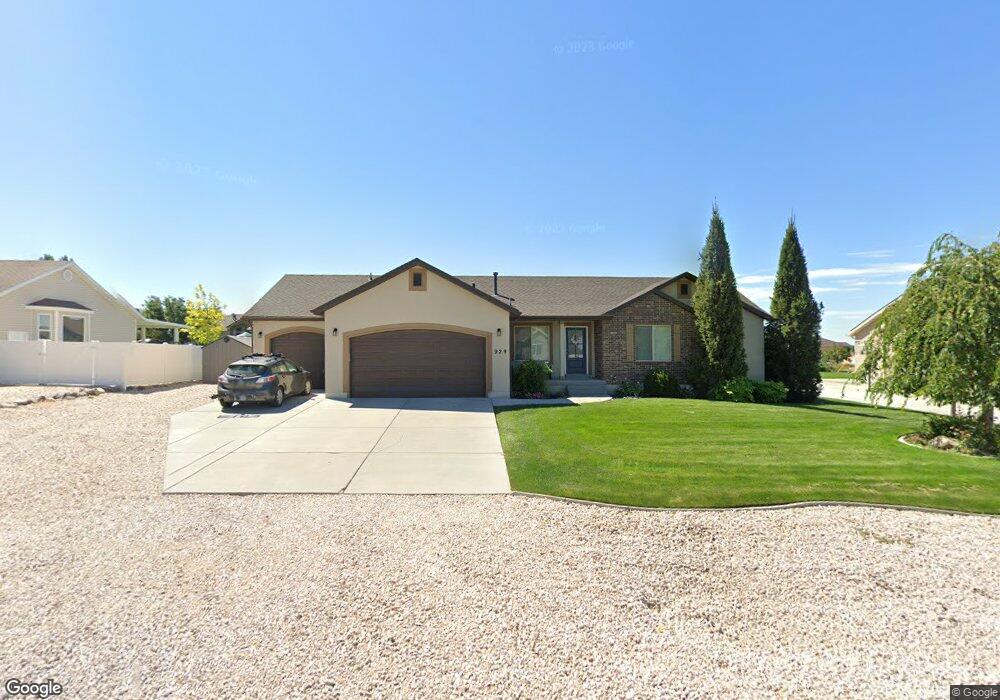
929 W 7300 S Willard, UT 84340
Estimated Value: $602,681 - $654,000
3
Beds
2
Baths
3,048
Sq Ft
$205/Sq Ft
Est. Value
About This Home
This home is located at 929 W 7300 S, Willard, UT 84340 and is currently estimated at $624,920, approximately $205 per square foot. 929 W 7300 S is a home located in Box Elder County with nearby schools including Three Mile Creek School, Adele C. Young Intermediate School, and Box Elder Middle School.
Ownership History
Date
Name
Owned For
Owner Type
Purchase Details
Closed on
Dec 11, 2012
Sold by
Sierra Homes Construction Inc
Bought by
Loosli D Spencer and Loosli Kandice K
Current Estimated Value
Home Financials for this Owner
Home Financials are based on the most recent Mortgage that was taken out on this home.
Original Mortgage
$211,400
Outstanding Balance
$146,328
Interest Rate
3.35%
Mortgage Type
New Conventional
Estimated Equity
$478,592
Purchase Details
Closed on
Jul 9, 2012
Sold by
Pettingill Estates Development Llc
Bought by
Sierra Homes Construction Inc
Home Financials for this Owner
Home Financials are based on the most recent Mortgage that was taken out on this home.
Original Mortgage
$162,000
Interest Rate
3.7%
Mortgage Type
Construction
Create a Home Valuation Report for This Property
The Home Valuation Report is an in-depth analysis detailing your home's value as well as a comparison with similar homes in the area
Purchase History
| Date | Buyer | Sale Price | Title Company |
|---|---|---|---|
| Loosli D Spencer | -- | American Secure Title Brigha | |
| Sierra Homes Construction Inc | -- | American Secure Title Brigh |
Source: Public Records
Mortgage History
| Date | Status | Borrower | Loan Amount |
|---|---|---|---|
| Open | Loosli D Spencer | $211,400 | |
| Previous Owner | Sierra Homes Construction Inc | $162,000 |
Source: Public Records
Tax History
| Year | Tax Paid | Tax Assessment Tax Assessment Total Assessment is a certain percentage of the fair market value that is determined by local assessors to be the total taxable value of land and additions on the property. | Land | Improvement |
|---|---|---|---|---|
| 2025 | $3,383 | $565,268 | $180,000 | $385,268 |
| 2024 | $2,818 | $536,438 | $180,000 | $356,438 |
| 2023 | $2,826 | $550,038 | $180,000 | $370,038 |
| 2022 | $2,622 | $265,288 | $49,500 | $215,788 |
| 2021 | $2,332 | $336,758 | $90,000 | $246,758 |
| 2020 | $2,161 | $336,758 | $90,000 | $246,758 |
| 2019 | $2,129 | $174,445 | $34,100 | $140,345 |
| 2018 | $2,048 | $156,140 | $34,100 | $122,040 |
| 2017 | $2,110 | $283,890 | $34,100 | $221,890 |
| 2016 | $2,029 | $150,328 | $34,100 | $116,228 |
| 2015 | $1,608 | $139,762 | $34,100 | $105,662 |
| 2014 | $1,608 | $134,730 | $32,571 | $102,159 |
| 2013 | -- | $125,927 | $32,571 | $93,356 |
Source: Public Records
Map
Nearby Homes
- 7535 S Hwy 89
- 7459 S 475 W
- 212 W 800 S
- 212 W 800 S Unit 340
- 3 W 825 S
- 242 W 825 S Unit 348
- 233 W 800 S
- 251 W 800 S Unit 347
- 204 W 800 S
- 204 W 800 S Unit 341
- 233 W 800 S Unit 345
- 252 W 800 S
- 245 W 775 S
- 245 W 775 S Unit 333
- 251 W 775 S Unit 334
- 251 W 775 S
- 246 W 775 S Unit 322
- 246 W 775 S
- 337 E Saddleback Rd
- 2110 W Frontage Rd
Your Personal Tour Guide
Ask me questions while you tour the home.