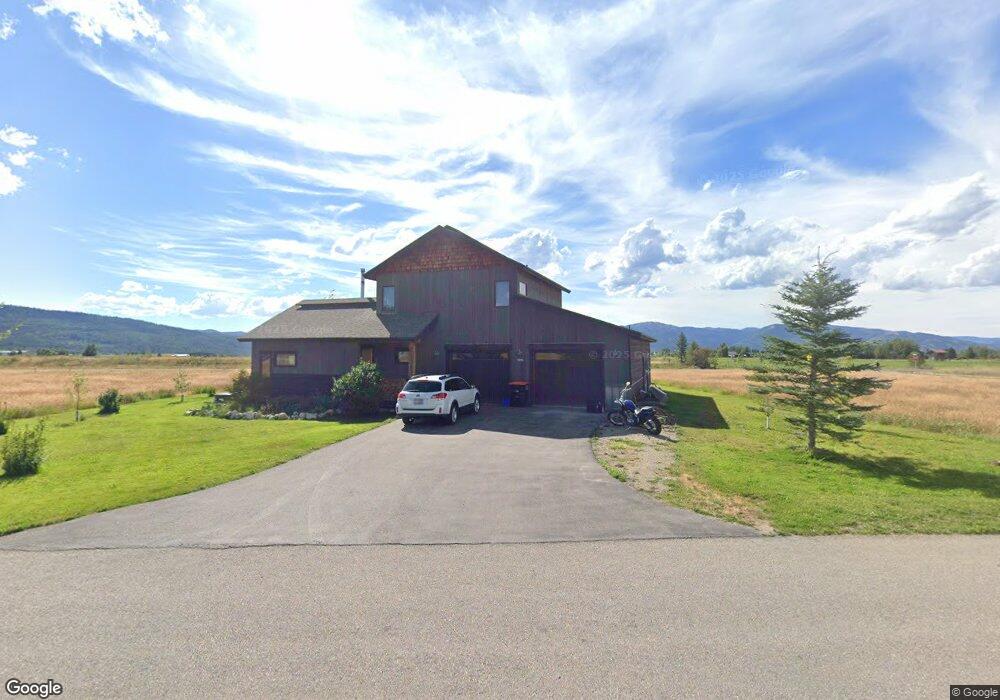
9290 Henley St Victor, ID 83455
Estimated Value: $989,434 - $1,452,000
3
Beds
3
Baths
2,248
Sq Ft
$513/Sq Ft
Est. Value
About This Home
This home is located at 9290 Henley St, Victor, ID 83455 and is currently estimated at $1,153,359, approximately $513 per square foot. 9290 Henley St is a home with nearby schools including Victor Elementary School and Teton High School.
Ownership History
Date
Name
Owned For
Owner Type
Purchase Details
Closed on
Apr 13, 2022
Sold by
Paul Knaub Jeffrey
Bought by
Thorn Molly Moon
Current Estimated Value
Purchase Details
Closed on
Jun 28, 2021
Sold by
Thorn Molly Moon
Bought by
Knaub Jeffrey Paul and Thorn Molly Moon
Home Financials for this Owner
Home Financials are based on the most recent Mortgage that was taken out on this home.
Original Mortgage
$203,200
Interest Rate
2.9%
Mortgage Type
New Conventional
Purchase Details
Closed on
Jul 18, 2008
Sold by
Thorn Molly Moon and Knaub Jeffrey Paul
Bought by
Knaub Jeffrey Paul and Thorn Molly Moon
Home Financials for this Owner
Home Financials are based on the most recent Mortgage that was taken out on this home.
Original Mortgage
$223,000
Interest Rate
3.47%
Mortgage Type
New Conventional
Create a Home Valuation Report for This Property
The Home Valuation Report is an in-depth analysis detailing your home's value as well as a comparison with similar homes in the area
Home Values in the Area
Average Home Value in this Area
Purchase History
| Date | Buyer | Sale Price | Title Company |
|---|---|---|---|
| Thorn Molly Moon | -- | None Listed On Document | |
| Knaub Jeffrey Paul | -- | North Idaho Title Co Coeur | |
| Thorn Molly Moon | -- | North Idaho Title Co Coeur | |
| Knaub Jeffrey Paul | -- | First American Title Driggs |
Source: Public Records
Mortgage History
| Date | Status | Borrower | Loan Amount |
|---|---|---|---|
| Previous Owner | Thorn Molly Moon | $203,200 | |
| Previous Owner | Knaub Jeffrey Paul | $223,000 |
Source: Public Records
Tax History Compared to Growth
Tax History
| Year | Tax Paid | Tax Assessment Tax Assessment Total Assessment is a certain percentage of the fair market value that is determined by local assessors to be the total taxable value of land and additions on the property. | Land | Improvement |
|---|---|---|---|---|
| 2025 | $2,733 | $837,272 | $160,000 | $677,272 |
| 2024 | $2,733 | $812,272 | $135,000 | $677,272 |
| 2023 | $2,733 | $802,272 | $125,000 | $677,272 |
| 2022 | $2,869 | $662,964 | $115,000 | $547,964 |
| 2021 | $2,739 | $443,858 | $60,000 | $383,858 |
| 2020 | $2,744 | $361,149 | $46,000 | $315,149 |
| 2019 | $2,656 | $357,149 | $42,000 | $315,149 |
| 2018 | $2,595 | $331,596 | $42,000 | $289,596 |
| 2017 | $2,264 | $315,269 | $32,000 | $283,269 |
| 2016 | $2,152 | $282,832 | $30,000 | $252,832 |
| 2015 | $1,986 | $241,444 | $22,000 | $219,444 |
| 2011 | -- | $265,903 | $41,000 | $224,903 |
Source: Public Records
Map
Nearby Homes
- 9189 Shelby St
- 9050 Megan St
- 9072 Megan St
- 9075 Nesting Eagles Loop
- 174 Christopher St
- 148 Christopher St
- 9270 Timberline Loop
- W 131 S 9500
- 375 S Agate Ave
- 5 Cold Springs Ln
- 8 Moulton Ln
- LOT 25 Lodge Pole Dr
- 19 Moulton Ln
- 975 W 9000 S
- 41 Moulton Ln
- 12 Cold Springs Rd
- 9 Targhee Trail
- 15 Springs Pkwy
- 9064 Village Way
- TBA Village Way
- 9268 Henley St
- 9289 Henley St
- 9269 Henley St
- 9238 Henley St
- 9329 Henley St
- 9218 Henley St
- 9340 Henley St
- LOT 84 Golf Vista Estates
- 9288 Shelby St
- 9266 Shelby St
- 9346 Henley St
- 9215 Henley
- 9345 Henley St
- 9196 Henley St
- 9330 Henley St
- 9195 Henley St
- 9372 Shelby St
- 950 S 50 W
- 9176 Henley St
- 9175 Henley St