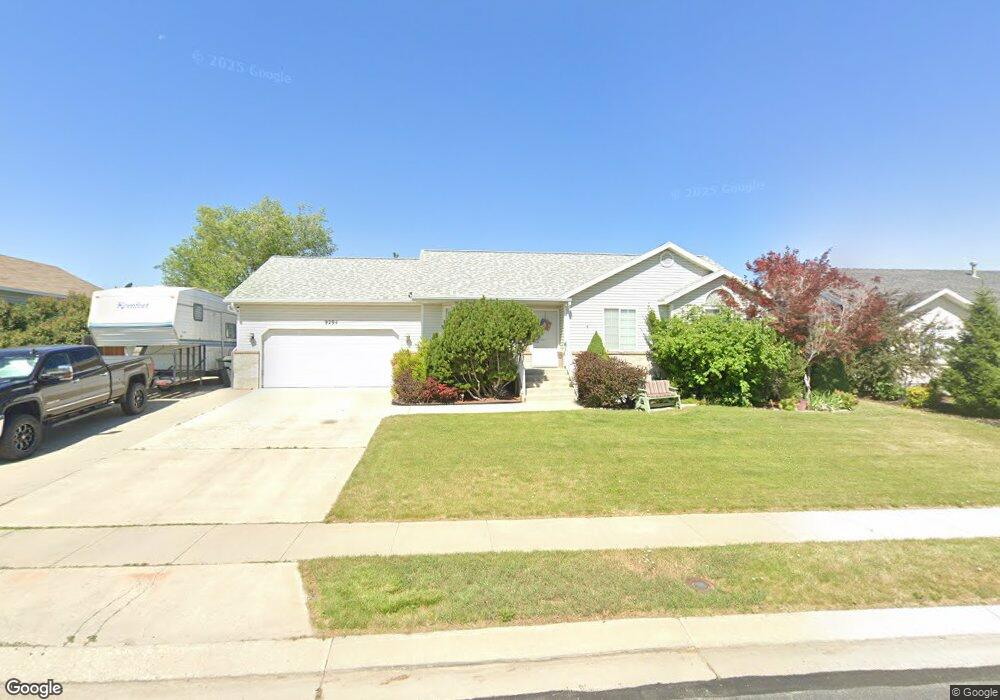
9294 Wild Clover Ln West Jordan, UT 84081
Copper Hills NeighborhoodEstimated Value: $546,000 - $648,000
3
Beds
2
Baths
1,281
Sq Ft
$456/Sq Ft
Est. Value
About This Home
This home is located at 9294 Wild Clover Ln, West Jordan, UT 84081 and is currently estimated at $583,871, approximately $455 per square foot. 9294 Wild Clover Ln is a home located in Salt Lake County with nearby schools including Copper Canyon School, West Hills Middle School, and Copper Hills High School.
Ownership History
Date
Name
Owned For
Owner Type
Purchase Details
Closed on
Aug 20, 2009
Sold by
Sommer George and Sommer Larie
Bought by
Sommer George and Sommer Laurie
Current Estimated Value
Home Financials for this Owner
Home Financials are based on the most recent Mortgage that was taken out on this home.
Original Mortgage
$188,000
Outstanding Balance
$122,327
Interest Rate
5.17%
Mortgage Type
New Conventional
Estimated Equity
$461,544
Purchase Details
Closed on
Jul 21, 2005
Sold by
Lefevre Matthew A
Bought by
Sommer George and Sommer Larie
Home Financials for this Owner
Home Financials are based on the most recent Mortgage that was taken out on this home.
Original Mortgage
$32,700
Interest Rate
5.08%
Mortgage Type
Stand Alone Second
Purchase Details
Closed on
Sep 18, 1997
Sold by
Kfp Corp
Bought by
Lefevre Matthew A
Home Financials for this Owner
Home Financials are based on the most recent Mortgage that was taken out on this home.
Original Mortgage
$107,000
Interest Rate
7.45%
Mortgage Type
Construction
Create a Home Valuation Report for This Property
The Home Valuation Report is an in-depth analysis detailing your home's value as well as a comparison with similar homes in the area
Home Values in the Area
Average Home Value in this Area
Purchase History
| Date | Buyer | Sale Price | Title Company |
|---|---|---|---|
| Sommer George | -- | Keystone Title Ins Agcy Llc | |
| Sommer George | -- | Surety Title | |
| Lefevre Matthew A | -- | -- |
Source: Public Records
Mortgage History
| Date | Status | Borrower | Loan Amount |
|---|---|---|---|
| Open | Sommer George | $188,000 | |
| Closed | Sommer George | $32,700 | |
| Closed | Sommer George | $174,400 | |
| Previous Owner | Lefevre Matthew A | $107,000 |
Source: Public Records
Tax History Compared to Growth
Tax History
| Year | Tax Paid | Tax Assessment Tax Assessment Total Assessment is a certain percentage of the fair market value that is determined by local assessors to be the total taxable value of land and additions on the property. | Land | Improvement |
|---|---|---|---|---|
| 2025 | $2,598 | $520,000 | $188,400 | $331,600 |
| 2024 | $2,598 | $499,800 | $182,200 | $317,600 |
| 2023 | $2,598 | $485,700 | $178,600 | $307,100 |
| 2022 | $2,681 | $478,200 | $175,100 | $303,100 |
| 2021 | $2,238 | $363,500 | $133,900 | $229,600 |
| 2020 | $2,115 | $322,400 | $119,500 | $202,900 |
| 2019 | $2,130 | $318,300 | $119,500 | $198,800 |
| 2018 | $2,002 | $296,700 | $117,100 | $179,600 |
| 2017 | $1,811 | $267,200 | $117,100 | $150,100 |
| 2016 | $1,773 | $245,800 | $117,100 | $128,700 |
| 2015 | $1,764 | $238,500 | $113,800 | $124,700 |
| 2014 | $1,687 | $224,500 | $108,200 | $116,300 |
Source: Public Records
Map
Nearby Homes
- 4904 Wild Acres Dr
- 9332 S Wild Clover Ln
- 5098 Cherry Laurel Ln
- 9118 S Wisteria Way
- 4565 Lennox Dr
- 9353 S 4460 W
- 4624 Pine Crossing Dr
- 8854 Rocky Creek Dr
- 4887 W 8620 S
- 4424 W Skye Dr
- 8577 Autumn Gold Cir
- 8793 S Big Bar Ct
- 8941 S Sun Leaf Dr
- 5582 Washoe Cove
- 4554 Birdie Way
- 10027 Birdie Way
- 9851 S Birdie Way
- 10117 S Glenmoor Dr
- 9375 S Laurel Ridge Cir
- 8441 S Spratling Dr
- 9294 S Wild Clover Ln
- 9282 Wild Clover Ln
- 9306 Wild Clover Ln
- 4999 Wild Acres Dr
- 9295 Wild Clover Ln
- 9316 S Wild Clover Ln
- 9316 Wild Clover Ln
- 9363 S Wild Clover Ln
- 9391 S Wild Clover Ln
- 9281 S Wild Clover Ln
- 9414 S Wild Clover Ln
- 4955 W Wild Acres Dr
- 4955 Wild Acres Dr
- 9309 S Wild Clover Ln
- 9309 Wild Clover Ln
- 5013 Wild Acres Dr
- 4984 Wild Acres Dr
- 9321 S Wild Clover Ln
- 9321 Wild Clover Ln
- 9332 Wild Clover Ln