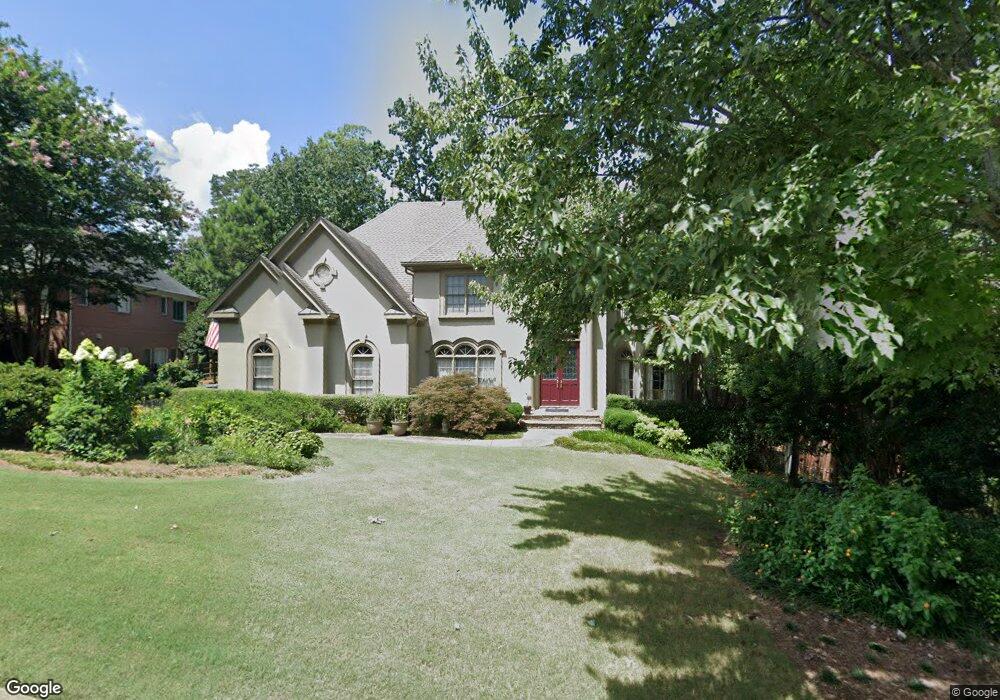
9295 Nesbit Lakes Dr Unit 4 Alpharetta, GA 30022
Nesbit Lakes NeighborhoodEstimated Value: $963,957 - $1,157,000
4
Beds
4
Baths
3,883
Sq Ft
$272/Sq Ft
Est. Value
About This Home
This home is located at 9295 Nesbit Lakes Dr Unit 4, Alpharetta, GA 30022 and is currently estimated at $1,056,489, approximately $272 per square foot. 9295 Nesbit Lakes Dr Unit 4 is a home located in Fulton County with nearby schools including Hillside Elementary School, Haynes Bridge Middle School, and Centennial High School.
Ownership History
Date
Name
Owned For
Owner Type
Purchase Details
Closed on
Aug 17, 1998
Sold by
Ruth Lawrence J and Ruth Lynn
Bought by
Watts Darrell K and Watts Michelle
Current Estimated Value
Home Financials for this Owner
Home Financials are based on the most recent Mortgage that was taken out on this home.
Original Mortgage
$289,000
Outstanding Balance
$60,291
Interest Rate
6.92%
Mortgage Type
New Conventional
Estimated Equity
$996,198
Purchase Details
Closed on
Jun 6, 1997
Sold by
Lutton H James
Bought by
Ruth Lawrence J
Home Financials for this Owner
Home Financials are based on the most recent Mortgage that was taken out on this home.
Original Mortgage
$200,000
Interest Rate
7%
Mortgage Type
New Conventional
Purchase Details
Closed on
Aug 23, 1995
Sold by
Schoch Stephen P Cynthia
Bought by
Lutton H James
Create a Home Valuation Report for This Property
The Home Valuation Report is an in-depth analysis detailing your home's value as well as a comparison with similar homes in the area
Home Values in the Area
Average Home Value in this Area
Purchase History
| Date | Buyer | Sale Price | Title Company |
|---|---|---|---|
| Watts Darrell K | $410,000 | -- | |
| Ruth Lawrence J | $386,000 | -- | |
| Lutton H James | $382,000 | -- |
Source: Public Records
Mortgage History
| Date | Status | Borrower | Loan Amount |
|---|---|---|---|
| Open | Watts Darrell K | $289,000 | |
| Previous Owner | Ruth Lawrence J | $200,000 |
Source: Public Records
Tax History Compared to Growth
Tax History
| Year | Tax Paid | Tax Assessment Tax Assessment Total Assessment is a certain percentage of the fair market value that is determined by local assessors to be the total taxable value of land and additions on the property. | Land | Improvement |
|---|---|---|---|---|
| 2025 | $1,298 | $308,320 | $78,440 | $229,880 |
| 2023 | $8,096 | $286,840 | $56,360 | $230,480 |
| 2022 | $5,888 | $236,000 | $43,640 | $192,360 |
| 2021 | $6,982 | $236,000 | $43,640 | $192,360 |
| 2020 | $6,553 | $247,240 | $43,640 | $203,600 |
| 2019 | $1,107 | $228,160 | $47,120 | $181,040 |
| 2018 | $5,868 | $222,800 | $46,000 | $176,800 |
| 2017 | $5,865 | $214,280 | $44,240 | $170,040 |
| 2016 | $5,838 | $214,280 | $44,240 | $170,040 |
| 2015 | $7,028 | $214,280 | $44,240 | $170,040 |
| 2014 | $4,856 | $171,160 | $25,880 | $145,280 |
Source: Public Records
Map
Nearby Homes
- 9195 Nesbit Lakes Dr
- 4040 Declaration Dr
- 109 W Ridge Way
- 940 Waters Reach Ct
- 920 Waters Reach Ct
- 1035 Penny Ln
- 205 Nesbit Entry Dr
- 530 Silver Pine Trail
- 3010 Kara Ct
- 3020 Kara Ct
- 590 Ridgemont Dr
- 245 Spring Ridge Trace
- 9110 Twelvestones Dr
- 2060 Six Branches Dr
- 420 Little Pines Ct
- 2030 Six Branches Dr
- 2765 Chandon Place
- 1250 Atherton Park
- 160 Arden Place
- 9285 Nesbit Lakes Dr Unit 4
- 9305 Nesbit Lakes Dr
- 9275 Nesbit Lakes Dr Unit 4
- 9290 Nesbit Lakes Dr Unit 4
- 9300 Nesbit Lakes Dr Unit 4
- 9315 Nesbit Lakes Dr
- 9280 Nesbit Lakes Dr
- 9265 Nesbit Lakes Dr
- 9310 Nesbit Lakes Dr
- 9270 Nesbit Lakes Dr Unit 4
- 300 Mistwater Trace
- 310 Mistwater Trace Unit 3
- 400 Water Shadow Ln
- 9260 Nesbit Lakes Dr Unit 4
- 410 Water Shadow Ln Unit 4
- 320 Mistwater Trace
- 9250 Scott Rd
- 9325 Nesbit Lakes Dr
- 305 Mistwater Trace
- 420 Water Shadow Ln