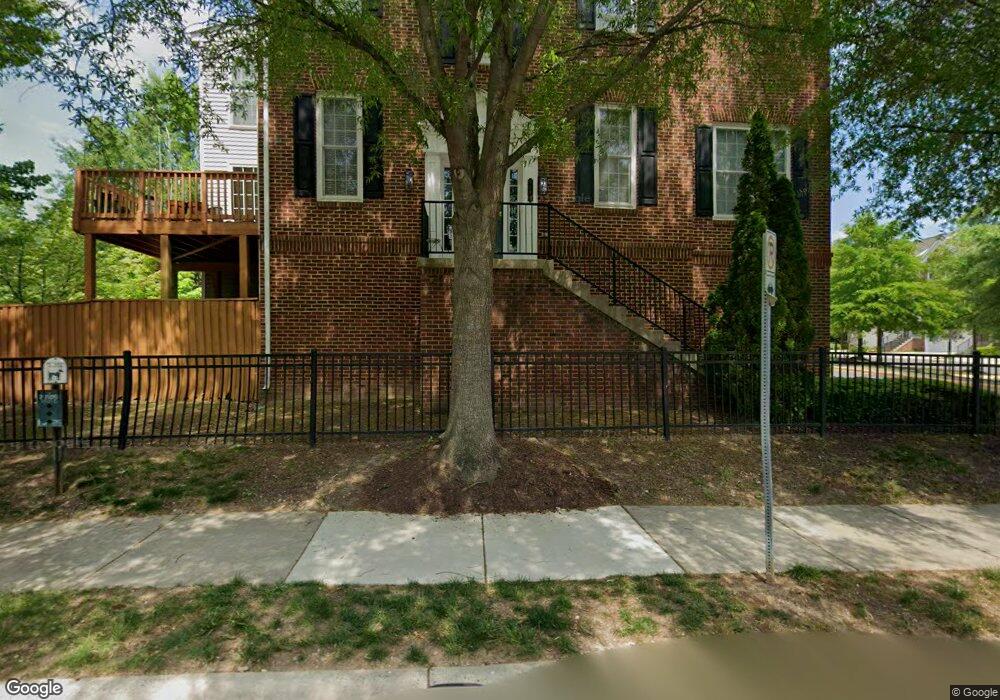
9298 Laurel Ridge Crossing Rd Lorton, VA 22079
Estimated Value: $721,000 - $794,000
4
Beds
4
Baths
2,188
Sq Ft
$350/Sq Ft
Est. Value
About This Home
This home is located at 9298 Laurel Ridge Crossing Rd, Lorton, VA 22079 and is currently estimated at $765,301, approximately $349 per square foot. 9298 Laurel Ridge Crossing Rd is a home located in Fairfax County with nearby schools including Laurel Hill Elementary School, South County Middle School, and South County High School.
Ownership History
Date
Name
Owned For
Owner Type
Purchase Details
Closed on
Nov 18, 2021
Sold by
Ali Mohammed A and Ali Mohammad A
Bought by
Ali Mohammad A and Chowdhury Dilara
Current Estimated Value
Home Financials for this Owner
Home Financials are based on the most recent Mortgage that was taken out on this home.
Original Mortgage
$363,500
Outstanding Balance
$330,757
Interest Rate
2.5%
Mortgage Type
New Conventional
Estimated Equity
$434,544
Purchase Details
Closed on
Oct 19, 2009
Sold by
Napier Thomas
Bought by
Chowdhury Dilara and Chowdhury Ali
Home Financials for this Owner
Home Financials are based on the most recent Mortgage that was taken out on this home.
Original Mortgage
$400,610
Interest Rate
5.09%
Mortgage Type
FHA
Purchase Details
Closed on
Nov 29, 2005
Sold by
Pulte Home Corp
Bought by
Napier Thomas
Home Financials for this Owner
Home Financials are based on the most recent Mortgage that was taken out on this home.
Original Mortgage
$542,600
Interest Rate
6.14%
Mortgage Type
New Conventional
Create a Home Valuation Report for This Property
The Home Valuation Report is an in-depth analysis detailing your home's value as well as a comparison with similar homes in the area
Home Values in the Area
Average Home Value in this Area
Purchase History
| Date | Buyer | Sale Price | Title Company |
|---|---|---|---|
| Ali Mohammad A | -- | None Listed On Document | |
| Ali Mohammad A | -- | Provident Title | |
| Chowdhury Dilara | $408,000 | -- | |
| Napier Thomas | $678,250 | -- |
Source: Public Records
Mortgage History
| Date | Status | Borrower | Loan Amount |
|---|---|---|---|
| Open | Ali Mohammad A | $363,500 | |
| Closed | Ali Mohammad A | $363,500 | |
| Previous Owner | Chowdhury Dilara | $400,610 | |
| Previous Owner | Napier Thomas | $542,600 |
Source: Public Records
Tax History Compared to Growth
Tax History
| Year | Tax Paid | Tax Assessment Tax Assessment Total Assessment is a certain percentage of the fair market value that is determined by local assessors to be the total taxable value of land and additions on the property. | Land | Improvement |
|---|---|---|---|---|
| 2025 | $8,119 | $726,670 | $190,000 | $536,670 |
| 2024 | $8,119 | $700,790 | $175,000 | $525,790 |
| 2023 | $7,882 | $698,460 | $175,000 | $523,460 |
| 2022 | $6,995 | $611,720 | $150,000 | $461,720 |
| 2021 | $6,698 | $570,750 | $140,000 | $430,750 |
| 2020 | $6,476 | $547,150 | $135,000 | $412,150 |
| 2019 | $6,058 | $511,880 | $120,000 | $391,880 |
| 2018 | $5,789 | $503,400 | $120,000 | $383,400 |
| 2017 | $5,844 | $503,400 | $120,000 | $383,400 |
| 2016 | $5,690 | $491,160 | $120,000 | $371,160 |
| 2015 | $5,295 | $474,430 | $115,000 | $359,430 |
| 2014 | $5,117 | $459,580 | $110,000 | $349,580 |
Source: Public Records
Map
Nearby Homes
- 8165 Halley Ct Unit 301
- 9257 Plaskett Ln
- 8205 Crossbrook Ct Unit 201
- 9253 Cardinal Forest Ln Unit 101
- 9215 Cardinal Forest Ln Unit 29
- 9220G Cardinal Forest Ln Unit 9220G
- 9220 Cardinal Forest Ln Unit E
- 8187 Douglas Fir Dr
- 8090 Paper Birch Dr
- 9071 Power House Rd Unit 102
- 9140 Stonegarden Dr
- 9400 Dandelion Dr
- 9407 Dandelion Dr
- 9421 Dandelion Dr
- 9410 Dandelion Dr
- 9150 Stonegarden Dr
- 8501 Barrow Furnace Ln
- 9414 Dandelion Dr
- 9416 Dandelion Dr
- 9426 Dandelion Dr
- 9296 Laurel Ridge Crossing Rd
- 9294 Laurel Ridge Crossing Rd
- 9292 Laurel Ridge Crossing Rd
- 0 Lorton Valley Rd
- 9218 Mccarty Rd
- 9280 Laurel Ridge Crossing Rd
- 9278 Laurel Ridge Crossing Rd
- 9220 Mccarty Rd
- 8199 Laurel Crossing Ln
- 8197 Laurel Crossing Ln
- 9276 Laurel Ridge Crossing Rd
- 8195 Laurel Crossing Ln
- 9205 Mccarty Rd
- 9203 Mccarty Rd
- 9207 Mccarty Rd
- 8181 Pasture Rose Ct
- 9222 Mccarty Rd
- 9209 Mccarty Rd
- 8179 Pasture Rose Ct
- 9274 Laurel Ridge Crossing Rd