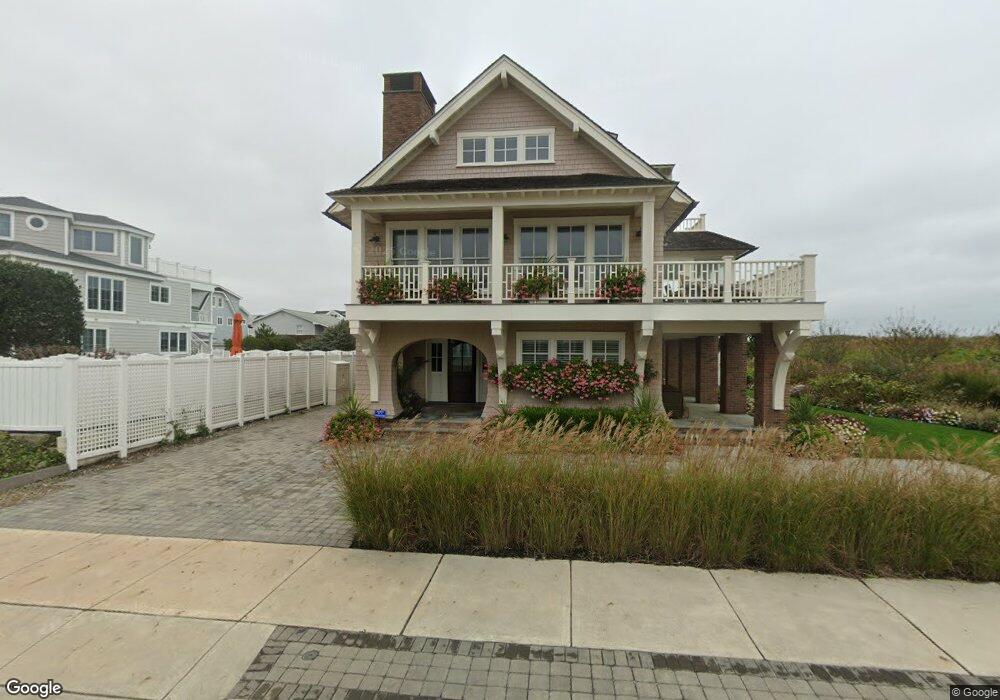
93 17th St E Avalon, NJ 08202
Estimated Value: $5,536,000 - $11,792,543
Studio
--
Bath
4,529
Sq Ft
$1,784/Sq Ft
Est. Value
About This Home
This home is located at 93 17th St E, Avalon, NJ 08202 and is currently estimated at $8,077,514, approximately $1,783 per square foot. 93 17th St E is a home located in Cape May County with nearby schools including Avalon Elementary School.
Ownership History
Date
Name
Owned For
Owner Type
Purchase Details
Closed on
Jul 23, 2024
Sold by
John P Costas Revocable Trust and Barbara S Costas Revocable Trust
Bought by
James J Maguire 2004 Annuity Trust and Nicoletti
Current Estimated Value
Purchase Details
Closed on
Nov 8, 2021
Sold by
Costas John P and Costas Barbara S
Bought by
John P Costas Revocable Trust and Barbara S Costas Revocable Trust
Purchase Details
Closed on
Jan 5, 2014
Sold by
93 E 17Th Street Llc
Bought by
Dune Holdings Llc
Purchase Details
Closed on
Jan 13, 2012
Sold by
Martin Ann W and Headman Mary W
Bought by
93 E 17Th Street Llc
Purchase Details
Closed on
Jun 4, 2004
Sold by
Martin Ann W and Headman Mary W
Bought by
Martin Ann W and Headman Mary W
Create a Home Valuation Report for This Property
The Home Valuation Report is an in-depth analysis detailing your home's value as well as a comparison with similar homes in the area
Home Values in the Area
Average Home Value in this Area
Purchase History
| Date | Buyer | Sale Price | Title Company |
|---|---|---|---|
| James J Maguire 2004 Annuity Trust | $11,950,000 | Sunset Title | |
| John P Costas Revocable Trust | -- | Surety Title | |
| John P Costas Revocable Trust | -- | Surety Title | |
| Dune Holdings Llc | $7,000,000 | Turnkey Title Llc | |
| 93 E 17Th Street Llc | $3,800,000 | None Available | |
| Martin Ann W | -- | None Available | |
| Martin Ann W | -- | -- |
Source: Public Records
Tax History
| Year | Tax Paid | Tax Assessment Tax Assessment Total Assessment is a certain percentage of the fair market value that is determined by local assessors to be the total taxable value of land and additions on the property. | Land | Improvement |
|---|---|---|---|---|
| 2025 | $42,296 | $6,888,600 | $5,250,000 | $1,638,600 |
| 2024 | $42,296 | $6,888,600 | $5,250,000 | $1,638,600 |
| 2023 | $41,952 | $6,888,600 | $5,250,000 | $1,638,600 |
| 2022 | $39,127 | $6,888,600 | $5,250,000 | $1,638,600 |
| 2021 | $37,681 | $6,888,600 | $5,250,000 | $1,638,600 |
| 2020 | $36,234 | $6,888,600 | $5,250,000 | $1,638,600 |
| 2019 | $35,132 | $6,888,600 | $5,250,000 | $1,638,600 |
| 2018 | $33,616 | $6,888,600 | $5,250,000 | $1,638,600 |
| 2017 | $26,569 | $4,778,600 | $3,350,000 | $1,428,600 |
| 2016 | $26,282 | $4,778,600 | $3,350,000 | $1,428,600 |
| 2015 | $25,852 | $4,778,600 | $3,350,000 | $1,428,600 |
| 2014 | $25,566 | $4,778,600 | $3,350,000 | $1,428,600 |
Source: Public Records
Map
Nearby Homes
Your Personal Tour Guide
Ask me questions while you tour the home.