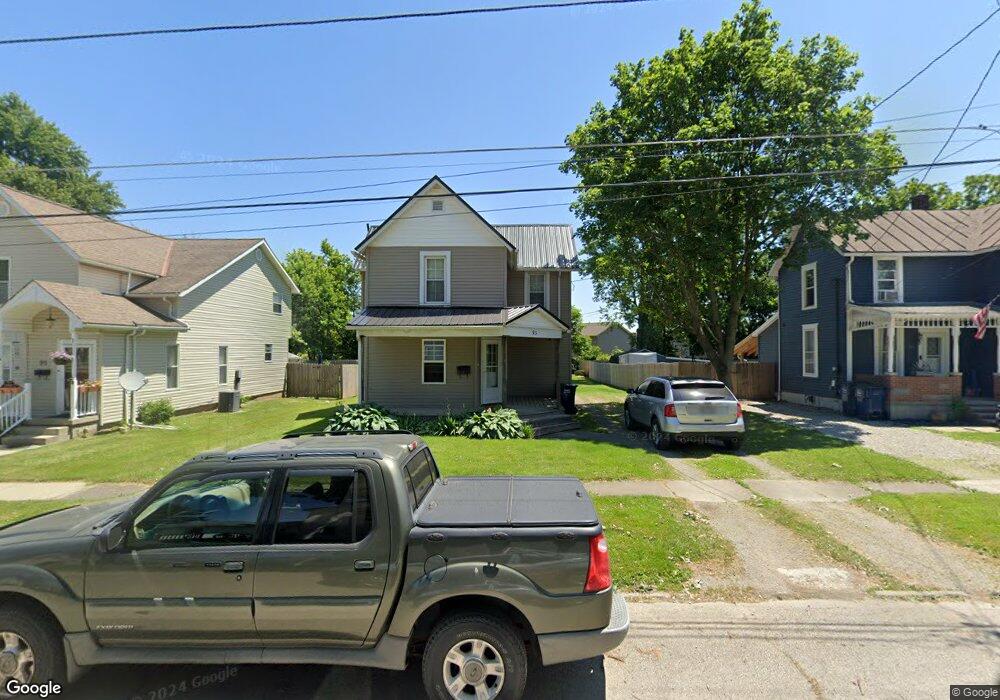
93 2nd St Shelby, OH 44875
Estimated Value: $96,000 - $108,764
2
Beds
2
Baths
1,352
Sq Ft
$75/Sq Ft
Est. Value
About This Home
This home is located at 93 2nd St, Shelby, OH 44875 and is currently estimated at $101,691, approximately $75 per square foot. 93 2nd St is a home located in Richland County with nearby schools including St. Mary's School.
Ownership History
Date
Name
Owned For
Owner Type
Purchase Details
Closed on
Jul 16, 2024
Sold by
Rietschlin Cheryl A and Rietschlin Luke
Bought by
Ewers Robert D and Banks Jordan E
Current Estimated Value
Home Financials for this Owner
Home Financials are based on the most recent Mortgage that was taken out on this home.
Original Mortgage
$96,030
Outstanding Balance
$94,362
Interest Rate
6.99%
Mortgage Type
New Conventional
Estimated Equity
$7,329
Purchase Details
Closed on
Apr 29, 2004
Sold by
Fannie Mae
Bought by
Rietschlin Cheryl A
Purchase Details
Closed on
Nov 7, 2003
Sold by
Fox Roberta J and Gmac Mortgage Corp
Bought by
Federal National Mortgage Association
Purchase Details
Closed on
Feb 28, 1996
Sold by
Mundey Joseph
Bought by
Fox Charles R and Fox Roberta J
Home Financials for this Owner
Home Financials are based on the most recent Mortgage that was taken out on this home.
Original Mortgage
$38,000
Interest Rate
7.07%
Mortgage Type
New Conventional
Create a Home Valuation Report for This Property
The Home Valuation Report is an in-depth analysis detailing your home's value as well as a comparison with similar homes in the area
Home Values in the Area
Average Home Value in this Area
Purchase History
| Date | Buyer | Sale Price | Title Company |
|---|---|---|---|
| Ewers Robert D | $99,000 | Tha Title | |
| Rietschlin Cheryl A | $17,100 | Title First Agency Inc | |
| Federal National Mortgage Association | $35,000 | Chicago Title | |
| Fox Charles R | $40,000 | -- |
Source: Public Records
Mortgage History
| Date | Status | Borrower | Loan Amount |
|---|---|---|---|
| Open | Ewers Robert D | $96,030 | |
| Previous Owner | Fox Charles R | $38,000 |
Source: Public Records
Tax History
| Year | Tax Paid | Tax Assessment Tax Assessment Total Assessment is a certain percentage of the fair market value that is determined by local assessors to be the total taxable value of land and additions on the property. | Land | Improvement |
|---|---|---|---|---|
| 2025 | $946 | $25,410 | $3,490 | $21,920 |
| 2024 | $946 | $25,410 | $3,490 | $21,920 |
| 2023 | $995 | $25,410 | $3,490 | $21,920 |
| 2022 | $995 | $22,720 | $3,630 | $19,090 |
| 2021 | $995 | $22,720 | $3,630 | $19,090 |
| 2020 | $996 | $22,720 | $3,630 | $19,090 |
| 2019 | $915 | $19,150 | $3,050 | $16,100 |
| 2018 | $907 | $19,150 | $3,050 | $16,100 |
| 2017 | $809 | $19,150 | $3,050 | $16,100 |
| 2016 | $720 | $15,440 | $3,870 | $11,570 |
| 2015 | $716 | $15,440 | $3,870 | $11,570 |
| 2014 | $692 | $15,440 | $3,870 | $11,570 |
| 2012 | $341 | $15,440 | $4,070 | $11,370 |
Source: Public Records
Map
Nearby Homes
- 100 1/2 Broadway St
- 100 Broadway St
- 41 3rd St
- 13 4th St
- 68 E Whitney Ave
- 74 E Whitney Ave
- 22 3rd St
- 10 Wentz Ave
- 32 Marvin Ave
- 16 High School Ave
- 159 E Main St
- 41 Sharon St
- 60 Grand Blvd
- 59 Sunset Dr
- 21 Franklin Ave
- 92 Grand Boulevard Extension
- 28 Mack Ave
- 58 Auburn Ave
- 54 Raymond Ave
- 67 S Gamble St
Your Personal Tour Guide
Ask me questions while you tour the home.