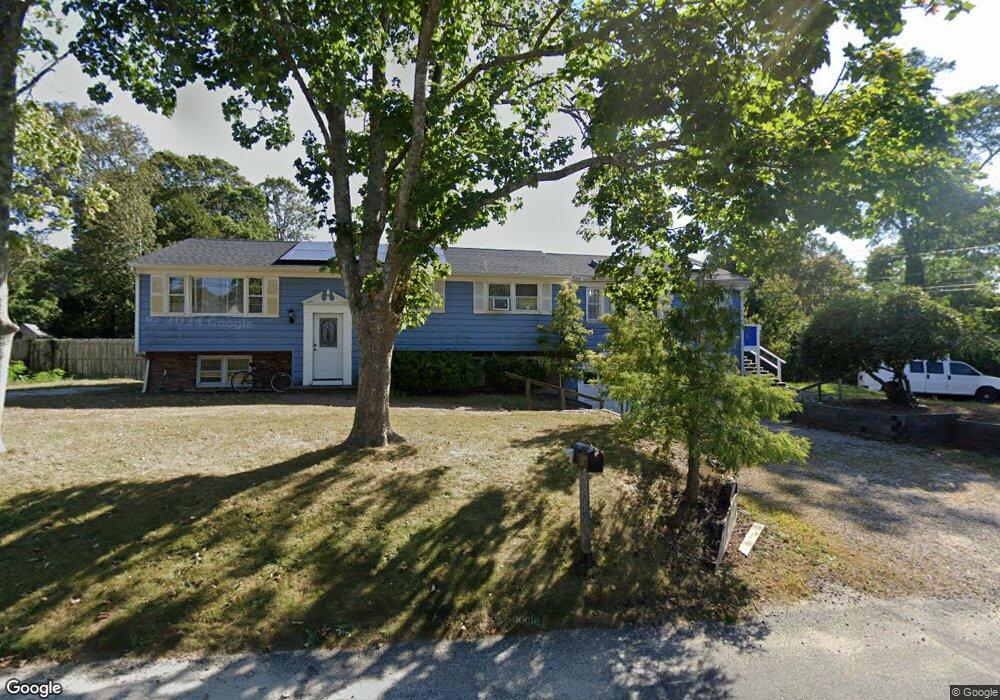
93 Arbor Way Hyannis, MA 02601
Hyannis NeighborhoodEstimated Value: $626,078 - $710,000
3
Beds
2
Baths
1,584
Sq Ft
$419/Sq Ft
Est. Value
About This Home
This home is located at 93 Arbor Way, Hyannis, MA 02601 and is currently estimated at $664,270, approximately $419 per square foot. 93 Arbor Way is a home located in Barnstable County with nearby schools including Hyannis West Elementary School, Barnstable United Elementary School, and Barnstable Intermediate School.
Ownership History
Date
Name
Owned For
Owner Type
Purchase Details
Closed on
Mar 30, 2018
Sold by
Fnma
Bought by
Alves-Teodoro Vilson
Current Estimated Value
Home Financials for this Owner
Home Financials are based on the most recent Mortgage that was taken out on this home.
Original Mortgage
$275,500
Outstanding Balance
$232,965
Interest Rate
4.38%
Mortgage Type
New Conventional
Estimated Equity
$431,305
Purchase Details
Closed on
Dec 15, 2017
Sold by
Montcalm Dora I
Bought by
Federal National Mortgage Association
Purchase Details
Closed on
Jul 1, 1987
Sold by
Montcalm Harriet W
Bought by
Montcalm Lloyd Stanley
Create a Home Valuation Report for This Property
The Home Valuation Report is an in-depth analysis detailing your home's value as well as a comparison with similar homes in the area
Home Values in the Area
Average Home Value in this Area
Purchase History
| Date | Buyer | Sale Price | Title Company |
|---|---|---|---|
| Alves-Teodoro Vilson | $290,000 | -- | |
| Federal National Mortgage Association | $293,493 | -- | |
| Montcalm Lloyd Stanley | $111,000 | -- |
Source: Public Records
Mortgage History
| Date | Status | Borrower | Loan Amount |
|---|---|---|---|
| Open | Alves-Teodoro Vilson | $275,500 |
Source: Public Records
Tax History
| Year | Tax Paid | Tax Assessment Tax Assessment Total Assessment is a certain percentage of the fair market value that is determined by local assessors to be the total taxable value of land and additions on the property. | Land | Improvement |
|---|---|---|---|---|
| 2025 | $5,093 | $549,400 | $151,300 | $398,100 |
| 2024 | $5,074 | $560,700 | $151,300 | $409,400 |
| 2023 | $4,703 | $491,400 | $137,500 | $353,900 |
| 2022 | $4,569 | $394,900 | $101,900 | $293,000 |
| 2021 | $4,195 | $352,200 | $101,900 | $250,300 |
| 2020 | $4,237 | $343,600 | $101,900 | $241,700 |
| 2019 | $3,865 | $307,200 | $101,900 | $205,300 |
| 2018 | $3,368 | $273,800 | $107,200 | $166,600 |
| 2017 | $3,156 | $263,200 | $107,200 | $156,000 |
| 2016 | $3,349 | $285,500 | $108,000 | $177,500 |
| 2015 | $3,096 | $267,600 | $104,400 | $163,200 |
Source: Public Records
Map
Nearby Homes
Your Personal Tour Guide
Ask me questions while you tour the home.