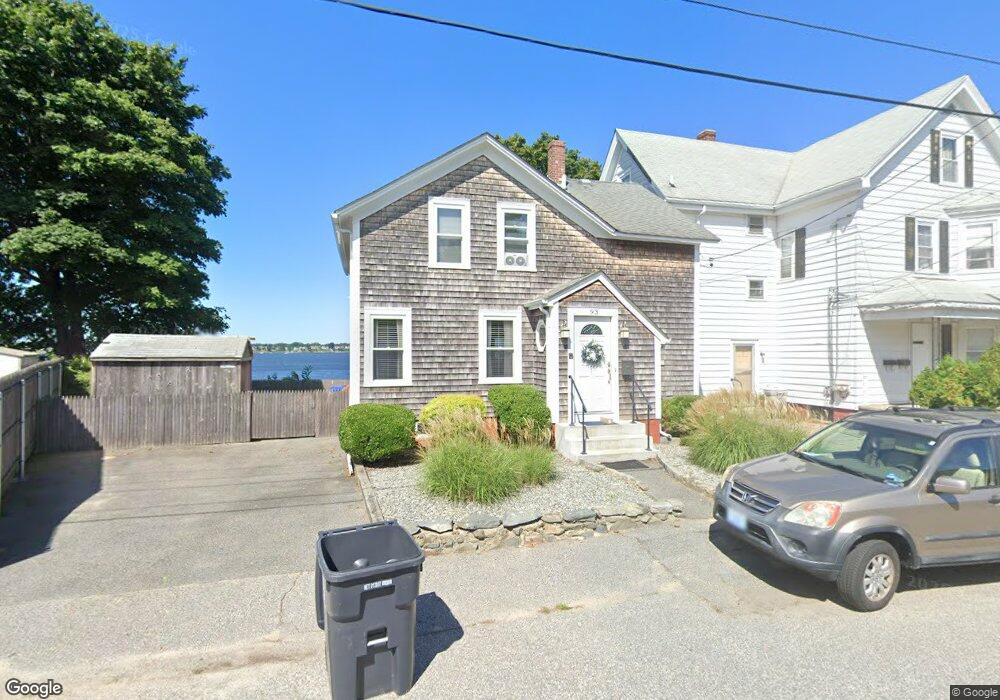
93 Bluff St Riverside, RI 02915
Riverside NeighborhoodEstimated Value: $638,539 - $758,000
3
Beds
2
Baths
1,300
Sq Ft
$535/Sq Ft
Est. Value
About This Home
This home is located at 93 Bluff St, Riverside, RI 02915 and is currently estimated at $695,885, approximately $535 per square foot. 93 Bluff St is a home located in Providence County with nearby schools including East Providence High School, St Mary Academy-Bay View, and St Luke Elementary School.
Ownership History
Date
Name
Owned For
Owner Type
Purchase Details
Closed on
Mar 29, 2012
Sold by
Crowley James P and Crowley Carol A
Bought by
Crowley James P
Current Estimated Value
Purchase Details
Closed on
Sep 23, 2009
Sold by
Levine Lori E
Bought by
Crowley James P and Crowley Carol A
Purchase Details
Closed on
Apr 28, 1993
Sold by
Ryan June M
Bought by
Thompson James C and Thompson Marie
Create a Home Valuation Report for This Property
The Home Valuation Report is an in-depth analysis detailing your home's value as well as a comparison with similar homes in the area
Home Values in the Area
Average Home Value in this Area
Purchase History
| Date | Buyer | Sale Price | Title Company |
|---|---|---|---|
| Crowley James P | -- | -- | |
| Crowley James P | $319,000 | -- | |
| Thompson James C | $78,000 | -- |
Source: Public Records
Mortgage History
| Date | Status | Borrower | Loan Amount |
|---|---|---|---|
| Previous Owner | Thompson James C | $222,000 | |
| Previous Owner | Thompson James C | $222,400 | |
| Previous Owner | Thompson James C | $165,000 |
Source: Public Records
Tax History
| Year | Tax Paid | Tax Assessment Tax Assessment Total Assessment is a certain percentage of the fair market value that is determined by local assessors to be the total taxable value of land and additions on the property. | Land | Improvement |
|---|---|---|---|---|
| 2025 | $9,396 | $718,900 | $445,200 | $273,700 |
| 2024 | $9,032 | $589,200 | $371,000 | $218,200 |
| 2023 | $8,697 | $589,200 | $371,000 | $218,200 |
| 2022 | $9,065 | $414,700 | $249,400 | $165,300 |
| 2021 | $8,916 | $414,700 | $249,400 | $165,300 |
| 2020 | $8,539 | $414,700 | $249,400 | $165,300 |
| 2019 | $8,302 | $414,700 | $249,400 | $165,300 |
| 2018 | $8,040 | $351,400 | $221,200 | $130,200 |
| 2017 | $7,861 | $351,400 | $221,200 | $130,200 |
| 2016 | $8,459 | $380,000 | $249,800 | $130,200 |
| 2015 | $5,561 | $242,300 | $125,700 | $116,600 |
| 2014 | $5,561 | $242,300 | $125,700 | $116,600 |
Source: Public Records
Map
Nearby Homes
- 129 Shore Rd
- 33 Pine St Unit 35
- 72 Stowe Ave
- 28 Jefferson Ave
- 41 White Ave
- 103 Burnside Ave
- 25 Arnold St
- 151 Willett Ave Unit 2
- 33 Bullocks Point Ave Unit 5C
- 43 Bullocks Point Ave Unit 4A
- 25 Bullocks Point Ave Unit 5C
- 6 Fuller Ave
- 0 Carousel Dr
- 10 Booth Ave
- 14 Winthrop St
- 15 Claire St
- 25 Winslow St
- 14 Benedict St
- 916 Bullocks Pt Ave
- 9 Mystic Ave
Your Personal Tour Guide
Ask me questions while you tour the home.