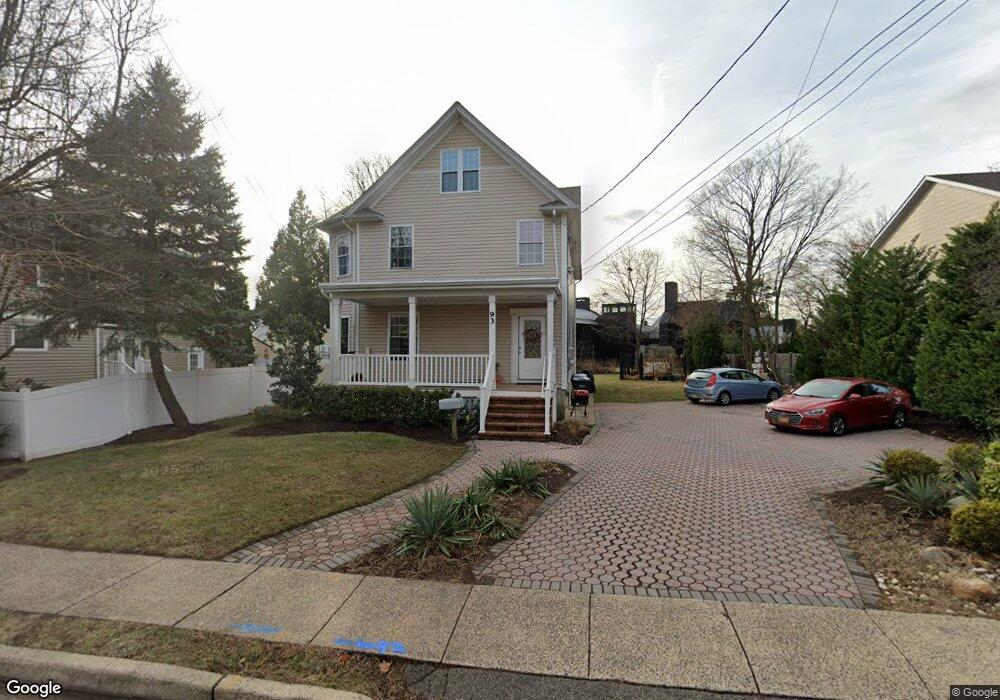
93 Center St Unit A Metuchen, NJ 08840
Estimated Value: $568,000 - $890,000
3
Beds
2
Baths
1,954
Sq Ft
$401/Sq Ft
Est. Value
About This Home
This home is located at 93 Center St Unit A, Metuchen, NJ 08840 and is currently estimated at $782,766, approximately $400 per square foot. 93 Center St Unit A is a home located in Middlesex County with nearby schools including Campbell Elementary School, Edgar Middle School, and Metuchen High School.
Ownership History
Date
Name
Owned For
Owner Type
Purchase Details
Closed on
Jun 22, 2016
Sold by
Us Bank Na
Bought by
Suburban Development Llc
Current Estimated Value
Purchase Details
Closed on
Dec 19, 1996
Sold by
Tagie Lucille
Bought by
Ceselka Vasil
Home Financials for this Owner
Home Financials are based on the most recent Mortgage that was taken out on this home.
Original Mortgage
$89,000
Interest Rate
7.48%
Create a Home Valuation Report for This Property
The Home Valuation Report is an in-depth analysis detailing your home's value as well as a comparison with similar homes in the area
Home Values in the Area
Average Home Value in this Area
Purchase History
| Date | Buyer | Sale Price | Title Company |
|---|---|---|---|
| Suburban Development Llc | $262,500 | Trident Abstract Title Agenc | |
| Ceselka Vasil | $118,000 | -- |
Source: Public Records
Mortgage History
| Date | Status | Borrower | Loan Amount |
|---|---|---|---|
| Previous Owner | Ceselka Vasil | $89,000 |
Source: Public Records
Tax History Compared to Growth
Tax History
| Year | Tax Paid | Tax Assessment Tax Assessment Total Assessment is a certain percentage of the fair market value that is determined by local assessors to be the total taxable value of land and additions on the property. | Land | Improvement |
|---|---|---|---|---|
| 2025 | $14,606 | $210,000 | $100,000 | $110,000 |
| 2024 | $14,116 | $210,000 | $100,000 | $110,000 |
| 2023 | $14,116 | $210,000 | $100,000 | $110,000 |
| 2022 | $13,379 | $210,000 | $100,000 | $110,000 |
| 2021 | $9,747 | $210,000 | $100,000 | $110,000 |
| 2020 | $12,900 | $210,000 | $100,000 | $110,000 |
| 2019 | $12,520 | $210,000 | $100,000 | $110,000 |
| 2018 | $12,474 | $210,000 | $100,000 | $110,000 |
| 2017 | $10,066 | $170,000 | $100,000 | $70,000 |
| 2016 | $9,636 | $167,000 | $99,000 | $68,000 |
| 2015 | $9,422 | $167,000 | $99,000 | $68,000 |
| 2014 | $9,126 | $165,900 | $98,700 | $67,200 |
Source: Public Records
Map
Nearby Homes