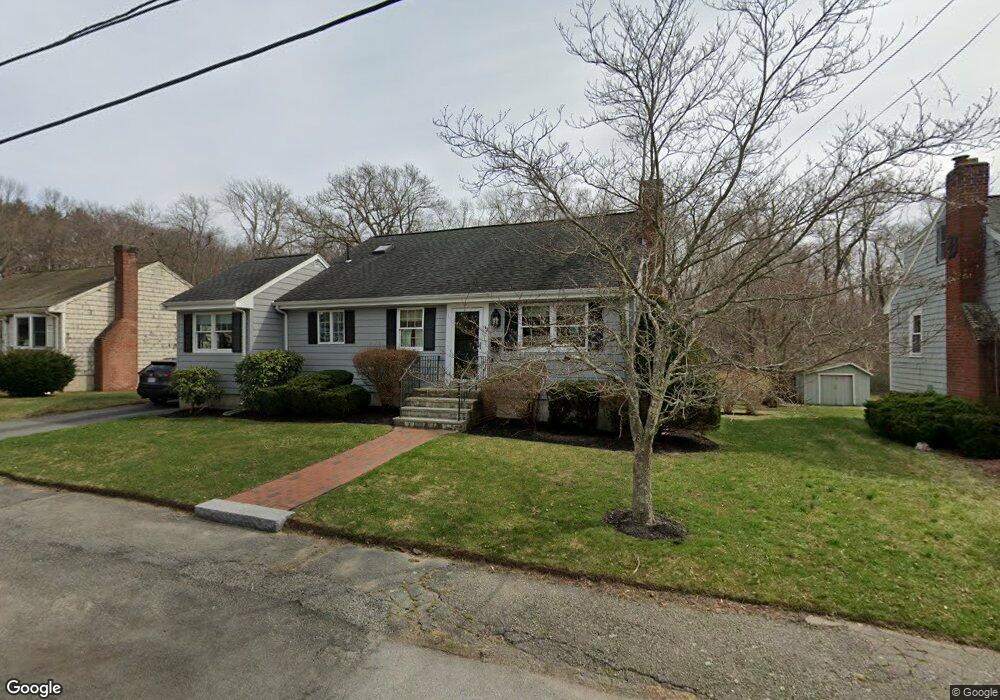
93 Chisholm Rd South Weymouth, MA 02190
South Weymouth NeighborhoodEstimated Value: $677,450 - $731,000
3
Beds
2
Baths
1,728
Sq Ft
$408/Sq Ft
Est. Value
About This Home
This home is located at 93 Chisholm Rd, South Weymouth, MA 02190 and is currently estimated at $704,863, approximately $407 per square foot. 93 Chisholm Rd is a home located in Norfolk County with nearby schools including Ralph Talbot Primary School, Abigail Adams Middle School, and Weymouth Middle School Chapman.
Ownership History
Date
Name
Owned For
Owner Type
Purchase Details
Closed on
Jun 22, 2023
Sold by
Macdonald Richard J
Bought by
Macdonald Cynthia E
Current Estimated Value
Purchase Details
Closed on
Jun 16, 2023
Sold by
Macdonald Ft and Macdonald
Bought by
Macdonald Richard J
Purchase Details
Closed on
May 13, 2019
Sold by
Macdonald Richard A and Macdonald Cynthia E
Bought by
Macdonald Ft and Macdonald
Create a Home Valuation Report for This Property
The Home Valuation Report is an in-depth analysis detailing your home's value as well as a comparison with similar homes in the area
Home Values in the Area
Average Home Value in this Area
Purchase History
| Date | Buyer | Sale Price | Title Company |
|---|---|---|---|
| Macdonald Cynthia E | -- | None Available | |
| Macdonald Cynthia E | -- | None Available | |
| Macdonald Richard J | -- | None Available | |
| Macdonald Richard J | -- | None Available | |
| Macdonald Ft | -- | -- | |
| Macdonald Ft | -- | -- |
Source: Public Records
Tax History Compared to Growth
Tax History
| Year | Tax Paid | Tax Assessment Tax Assessment Total Assessment is a certain percentage of the fair market value that is determined by local assessors to be the total taxable value of land and additions on the property. | Land | Improvement |
|---|---|---|---|---|
| 2025 | $5,444 | $539,000 | $226,300 | $312,700 |
| 2024 | $5,260 | $512,200 | $215,500 | $296,700 |
| 2023 | $5,148 | $492,600 | $217,700 | $274,900 |
| 2022 | $5,081 | $443,400 | $201,600 | $241,800 |
| 2021 | $4,916 | $418,700 | $201,600 | $217,100 |
| 2020 | $4,712 | $395,300 | $201,600 | $193,700 |
| 2019 | $4,597 | $379,300 | $193,800 | $185,500 |
| 2018 | $4,528 | $362,200 | $184,600 | $177,600 |
| 2017 | $4,419 | $345,000 | $175,800 | $169,200 |
| 2016 | $4,248 | $331,900 | $169,100 | $162,800 |
| 2015 | $4,094 | $317,400 | $169,100 | $148,300 |
| 2014 | $3,874 | $291,300 | $157,300 | $134,000 |
Source: Public Records
Map
Nearby Homes
- 279 Pine St
- 4 Edward Cody Ln
- 15 Ranger Cir
- 79 Tilden Rd
- 376 Pleasant St
- 25 Wales Ave
- 18 Ben Hogan Landing Unit 18
- 299 Union St
- 261 Pleasant St Unit 3
- 261 Pleasant St Unit 5
- 17 Buchanan Ln
- 110 Burkhall St Unit H
- 102 White St
- 120 Burkhall St Unit K
- 45 Union St
- 200 Burkhall St Unit 803
- 200 Burkhall St Unit 102
- 191 Tall Oaks Dr Unit C
- 675 Pleasant St Unit 8
- 540 Union St