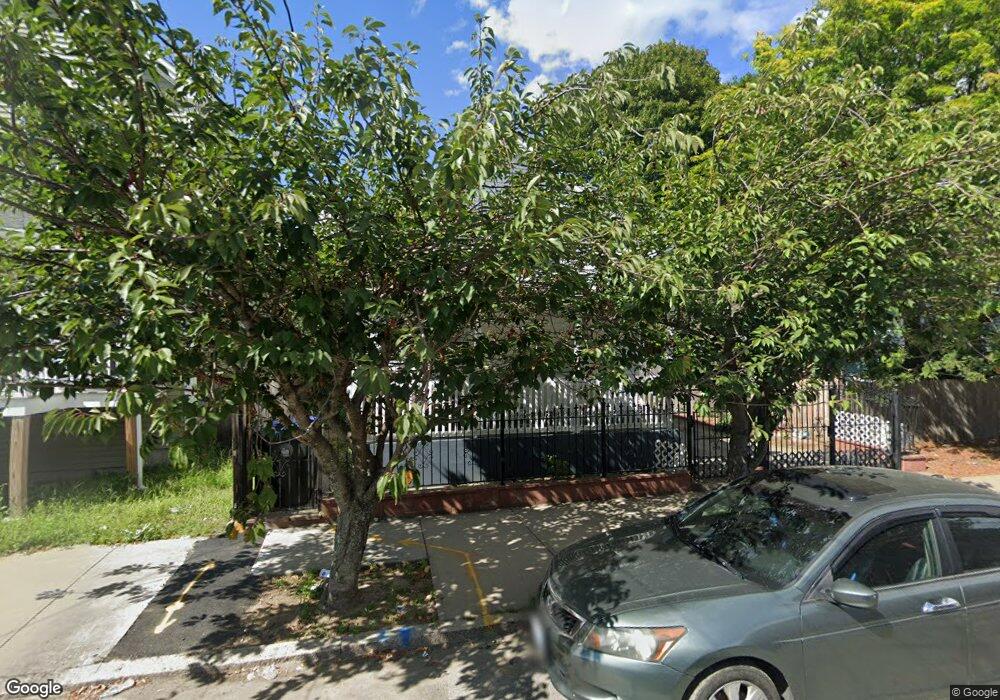
93 Colfax St Providence, RI 02905
Lower South Providence NeighborhoodEstimated Value: $268,000 - $334,000
3
Beds
1
Bath
882
Sq Ft
$342/Sq Ft
Est. Value
About This Home
This home is located at 93 Colfax St, Providence, RI 02905 and is currently estimated at $301,599, approximately $341 per square foot. 93 Colfax St is a home located in Providence County with nearby schools including Asa Messer Elementary School, Charles N. Fortes Elementary School, and Robert L. Bailey IV Elementary.
Ownership History
Date
Name
Owned For
Owner Type
Purchase Details
Closed on
Jun 8, 2010
Sold by
Perrotta John M
Bought by
Ramirez Marlan A
Current Estimated Value
Home Financials for this Owner
Home Financials are based on the most recent Mortgage that was taken out on this home.
Original Mortgage
$68,000
Outstanding Balance
$45,734
Interest Rate
5.12%
Mortgage Type
Purchase Money Mortgage
Estimated Equity
$255,865
Purchase Details
Closed on
May 15, 2009
Sold by
Asset Mgmt West 8 Llc
Bought by
Peccotta John M
Purchase Details
Closed on
Mar 9, 2000
Sold by
Martinez Pablo
Bought by
Martinez Matilde and Aquilar Maria
Home Financials for this Owner
Home Financials are based on the most recent Mortgage that was taken out on this home.
Original Mortgage
$65,172
Interest Rate
8.18%
Create a Home Valuation Report for This Property
The Home Valuation Report is an in-depth analysis detailing your home's value as well as a comparison with similar homes in the area
Home Values in the Area
Average Home Value in this Area
Purchase History
| Date | Buyer | Sale Price | Title Company |
|---|---|---|---|
| Ramirez Marlan A | $69,000 | -- | |
| Peccotta John M | $44,000 | -- | |
| Asset Mgmt West 8 Llc | $105,000 | -- | |
| Martinez Matilde | $30,000 | -- |
Source: Public Records
Mortgage History
| Date | Status | Borrower | Loan Amount |
|---|---|---|---|
| Open | Martinez Matilde | $68,000 | |
| Previous Owner | Martinez Matilde | $105,000 | |
| Previous Owner | Martinez Matilde | $68,031 | |
| Previous Owner | Martinez Matilde | $65,172 |
Source: Public Records
Tax History Compared to Growth
Tax History
| Year | Tax Paid | Tax Assessment Tax Assessment Total Assessment is a certain percentage of the fair market value that is determined by local assessors to be the total taxable value of land and additions on the property. | Land | Improvement |
|---|---|---|---|---|
| 2025 | $2,140 | $254,800 | $118,500 | $136,300 |
| 2024 | $3,404 | $185,500 | $75,100 | $110,400 |
| 2023 | $3,404 | $185,500 | $75,100 | $110,400 |
| 2022 | $3,302 | $185,500 | $75,100 | $110,400 |
| 2021 | $2,439 | $99,300 | $33,100 | $66,200 |
| 2020 | $2,439 | $99,300 | $33,100 | $66,200 |
| 2019 | $2,439 | $99,300 | $33,100 | $66,200 |
| 2018 | $2,355 | $73,700 | $30,100 | $43,600 |
| 2017 | $2,355 | $73,700 | $30,100 | $43,600 |
| 2016 | $2,355 | $73,700 | $30,100 | $43,600 |
| 2015 | $2,383 | $72,000 | $30,100 | $41,900 |
| 2014 | $2,430 | $72,000 | $30,100 | $41,900 |
| 2013 | $2,430 | $72,000 | $30,100 | $41,900 |
Source: Public Records
Map
Nearby Homes