93 County Rd Marion, MA 02738
Estimated Value: $604,698 - $675,000
About This Home
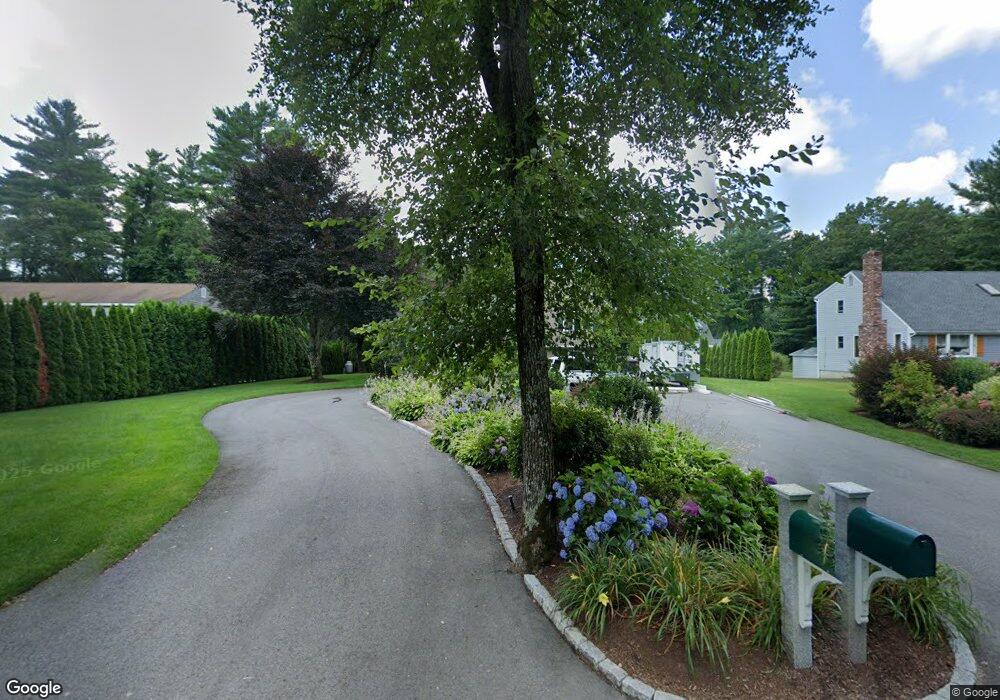
This home is located at 93 County Rd, Marion, MA 02738 and is currently estimated at $639,675, approximately $325 per square foot. 93 County Rd is a home located in Plymouth County with nearby schools including Old Rochester Regional High School and Tabor Academy.
Ownership History
We collect this data history from publicly available records. To have your information removed, we recommend requesting removal directly through your county’s website.
Purchase Details
Purchase Details
Purchase History
We collect this data history from publicly available records. To have your information removed, we recommend requesting removal directly through your county’s website.
| Date | Buyer | Sale Price | Title Company |
|---|---|---|---|
| -- | -- | ||
| -- | -- | ||
| -- | -- |
Mortgage History
We collect this data history from publicly available records. To have your information removed, we recommend requesting removal directly through your county’s website.
| Date | Status | Borrower | Loan Amount |
|---|---|---|---|
| Closed | $150,000 | ||
| Closed | $75,000 | ||
| Closed | $250,000 | ||
| Closed | $250,000 | ||
| Closed | $127,600 |
Tax History
We collect this data history from publicly available records. To have your information removed, we recommend requesting removal directly through your county’s website.
| Year | Tax Paid | Tax Assessment Tax Assessment Total Assessment is a certain percentage of the fair market value that is determined by local assessors to be the total taxable value of land and additions on the property. | Land | Improvement |
|---|---|---|---|---|
| 2025 | $4,240 | $454,900 | $188,800 | $266,100 |
| 2024 | $3,947 | $426,200 | $165,200 | $261,000 |
| 2023 | $4,693 | $497,100 | $236,100 | $261,000 |
| 2022 | $4,366 | $402,400 | $145,300 | $257,100 |
| 2021 | $4,443 | $392,500 | $127,100 | $265,400 |
| 2020 | $4,562 | $389,900 | $127,100 | $262,800 |
| 2019 | $4,301 | $389,900 | $127,100 | $262,800 |
| 2018 | $3,930 | $343,200 | $124,000 | $219,200 |
| 2017 | $3,674 | $322,000 | $124,000 | $198,000 |
| 2016 | $3,762 | $332,600 | $124,000 | $208,600 |
| 2015 | $3,892 | $350,300 | $131,100 | $219,200 |
Map
- 127 County Rd
- 586-B Front Street Briggs Terrace
- 659 Front St
- 55 Bullivant Farm Rd
- 189 Blackmore Pond Rd
- 245 Wareham Rd
- 170 Wareham Rd
- 4 Blackhall Ct
- 7 Blackhall Ct
- 17 Fieldstone Ln
- 7 Oak St
- 63 Oakdale Ave
- 21 River Rd
- 4 Marconi Ln
- 64 Rosepoint Ave
- 329 Front St
- 304 Front St
- 468 Mill St
- 39 Ryder Ln
- 37 Lincoln Hwy
Ask me questions while you tour the home.