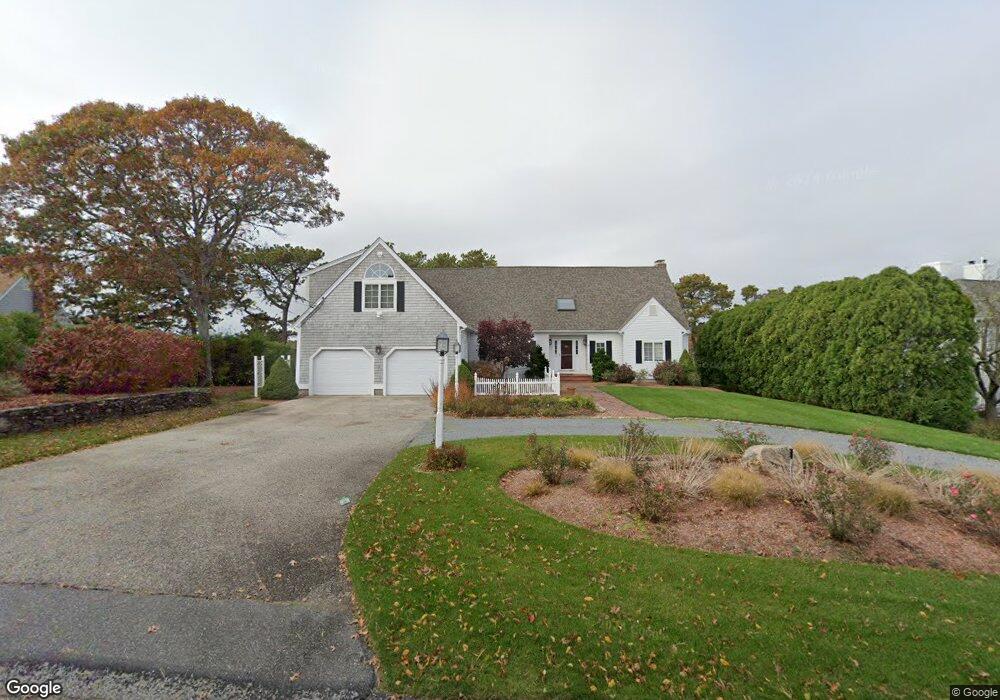
93 Cove Rd South Dennis, MA 02660
West Dennis NeighborhoodEstimated Value: $2,052,335 - $3,519,000
7
Beds
5
Baths
5,473
Sq Ft
$511/Sq Ft
Est. Value
About This Home
This home is located at 93 Cove Rd, South Dennis, MA 02660 and is currently estimated at $2,798,334, approximately $511 per square foot. 93 Cove Rd is a home located in Barnstable County with nearby schools including Dennis-Yarmouth Regional High School and St. Pius X. School.
Ownership History
Date
Name
Owned For
Owner Type
Purchase Details
Closed on
Aug 23, 2024
Sold by
Clare M Warren Ret and Warren
Bought by
Clare M Warren Ret and Molloy
Current Estimated Value
Purchase Details
Closed on
Jan 13, 2024
Sold by
Warren Irt and Warren
Bought by
Clare M Warren Ret and Warren
Purchase Details
Closed on
Oct 21, 2016
Sold by
Warren Cove Road Rt and Warren
Bought by
Warren Irt and Warren
Create a Home Valuation Report for This Property
The Home Valuation Report is an in-depth analysis detailing your home's value as well as a comparison with similar homes in the area
Home Values in the Area
Average Home Value in this Area
Purchase History
| Date | Buyer | Sale Price | Title Company |
|---|---|---|---|
| Clare M Warren Ret | -- | None Available | |
| Clare M Warren Ret | -- | None Available | |
| Clare M Warren Ret | -- | None Available | |
| Clare M Warren Ret | -- | None Available | |
| Warren Irt | -- | -- | |
| Warren Irt | -- | -- |
Source: Public Records
Tax History Compared to Growth
Tax History
| Year | Tax Paid | Tax Assessment Tax Assessment Total Assessment is a certain percentage of the fair market value that is determined by local assessors to be the total taxable value of land and additions on the property. | Land | Improvement |
|---|---|---|---|---|
| 2025 | $8,951 | $2,067,100 | $763,300 | $1,303,800 |
| 2024 | $8,719 | $1,986,100 | $734,100 | $1,252,000 |
| 2023 | $8,470 | $1,813,600 | $675,200 | $1,138,400 |
| 2022 | $8,203 | $1,464,900 | $608,200 | $856,700 |
| 2021 | $8,228 | $1,364,500 | $624,000 | $740,500 |
| 2020 | $3,973 | $1,303,100 | $596,300 | $706,800 |
| 2019 | $7,493 | $1,214,400 | $584,600 | $629,800 |
| 2018 | $3,612 | $1,320,400 | $711,800 | $608,600 |
| 2017 | $3,518 | $1,320,400 | $711,800 | $608,600 |
| 2016 | $8,560 | $1,310,900 | $789,400 | $521,500 |
| 2015 | $8,390 | $1,310,900 | $789,400 | $521,500 |
| 2014 | $8,219 | $1,294,400 | $789,400 | $505,000 |
Source: Public Records
Map
Nearby Homes
- 3 Pinefield Ln
- 295 Main St
- 293 Main St
- 293 Main St
- 26 Center St
- 428 Main St Unit 1-11
- 467 Main St
- 15 Woodside Park Rd
- 401 Main St Unit 201
- 401 Main St Unit 101
- 95 Center St
- 23 Fairwood Rd
- 23 Doric Ave
- 401 Main St Unit 201
- 401 Main St Unit 101
- 18 Curve Hill Rd
- 31 Duck Pond Rd
- 21 Green Way
- 1 Country Club Dr
- 61 Trotters Ln