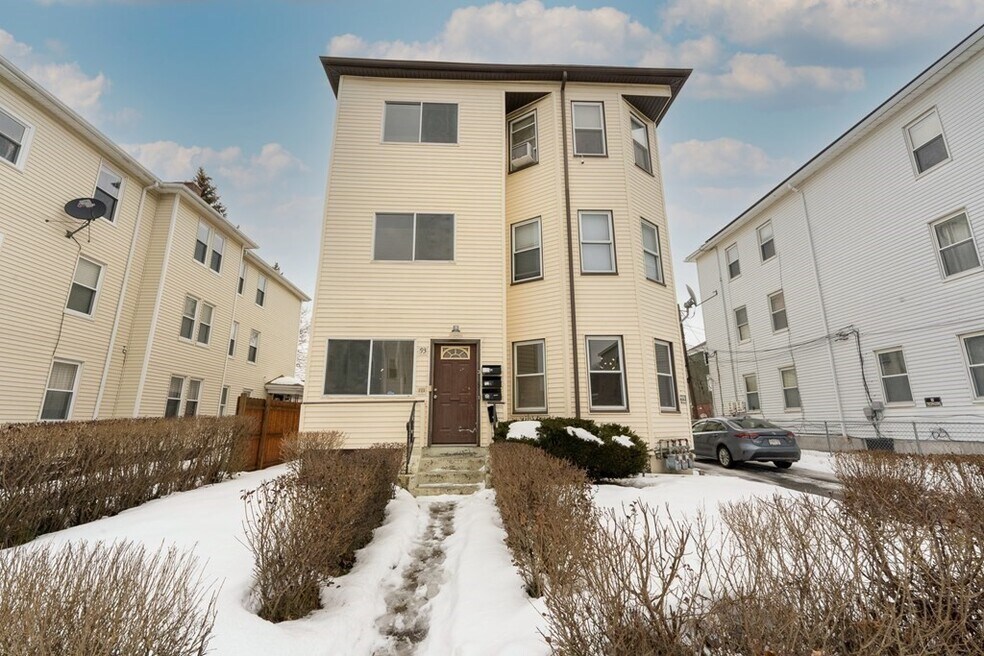
NOT LISTED FOR SALE

Estimated Value: $650,467 - $739,000

3 Beds
1 Bath
1,200 Sq Ft
$584/Sq Ft Est. Value

About This Home

This home is located at 93 Cutler St Unit 3, Worcester, MA 01604 and is currently estimated at $700,617, approximately $583 per square foot. 93 Cutler St Unit 3 is a home located in Worcester County with nearby schools including Jacob Hiatt Magnet School, Chandler Magnet, and Union Hill School.

Ownership History

Date Name Owned For Owner Type

Purchase Details

Closed on
Sep 29, 2021
Sold by
Wrobleswki Rafael
Bought by
Freedom Alliances Llc
Current Estimated Value
$700,617

Purchase Details

Closed on
May 20, 2021
Sold by
Naif Salwa I
Bought by
Wroblewski Rafael

Home Financials for this Owner

Home Financials are based on the most recent Mortgage that was taken out on this home.
Original Mortgage
$375,000
Interest Rate
3.1%
Mortgage Type
Purchase Money Mortgage

Purchase Details

Closed on
Mar 22, 2019
Sold by
Ghanoum Nabel M
Bought by
Naif Salwa I

Home Financials for this Owner

Home Financials are based on the most recent Mortgage that was taken out on this home.
Original Mortgage
$285,600
Interest Rate
4.4%
Mortgage Type
New Conventional

Purchase Details

Closed on
Aug 1, 2013
Sold by
Blanculli Richard M and Bianculli Jeremiah J
Bought by
Ghanoum Nabel M

Home Financials for this Owner

Home Financials are based on the most recent Mortgage that was taken out on this home.
Original Mortgage
$247,435
Interest Rate
4.25%
Mortgage Type
FHA
Source: Public Records

Range of Values:

Collateral Analytics

Collateral Analytics Collateral Analytics AVMs (Automated Valuation Model) employ a number of statistical approaches combined with neighborhood-specific comparable selection guarantees the most up-to-date and precise valuations.

Not Available

Collateral Analytics does not have data for the current month. Please view the chart for historical values.

ICE

ICE Mortgage Technology ICE Mortgage Technology’s AVM (Automated Valuation Model) is a state-of-the-art online residential property valuation tool that provides a quick and accurate estimate of the value of almost any home in the U.S.

Not Available

ICE Mortgage Technology does not have data for the current month. Please view the chart for historical values.

First American

First American First American Data & Analytics’ next-generation AVM combines unrivaled data assets with a blended ensemble of valuation models to produce highly accurate, reliable valuations you can trust.

Not Available

First American does not have data for the current month. Please view the chart for historical values.

Quantarium

Quantarium Quantarium’s valuation service, repeatedly proven the industry’s most accurate and comprehensive, is supercharged with a self-learning and auto-tuning AI engine that continually becomes smarter and more accurate as it processes daily inputs from the industry’s leading RE data lake.

Not Available

Quantarium does not have data for the current month. Please view the chart for historical values.

Average Value
Not Available
List Price
Sold Price
Create a Home Valuation Report for This Property
The Home Valuation Report is an in-depth analysis detailing your home's value as well as a comparison with similar homes in the area

Home Values in the Area

Source: Public Records

Average Home Value in this Area


Source: Public Records

Purchase History

Date Buyer Sale Price Title Company
Freedom Alliances Llc -- None Available
Wroblewski Rafael $500,000 None Available
Naif Salwa I $357,000 --
Ghanoum Nabel M $252,000 --
Source: Public Records

Mortgage History

Date Status Borrower Loan Amount
Previous Owner Wroblewski Rafael $375,000
Previous Owner Naif Salwa I $285,600
Previous Owner Naif Selwa I $54,400
Previous Owner Ghanoum Nabel M $247,435
Source: Public Records

Tax History Compared to Growth

Source: Public Records

Tax History

Year Tax Paid Tax Assessment Tax Assessment Total Assessment is a certain percentage of the fair market value that is determined by local assessors to be the total taxable value of land and additions on the property. Land Improvement
2025 $7,803 $591,600 $76,700 $514,900
2024 $7,208 $524,200 $76,700 $447,500
2023 $6,859 $478,300 $61,600 $416,700
2022 $6,022 $395,900 $49,300 $346,600
2021 $6,269 $385,100 $39,400 $345,700
2020 $5,005 $294,400 $39,500 $254,900
2019 $5,099 $283,300 $39,000 $244,300
2018 $4,998 $264,300 $39,000 $225,300
2017 $4,703 $244,700 $39,000 $205,700
2016 $4,604 $223,400 $31,200 $192,200
2015 $4,484 $223,400 $31,200 $192,200
2014 $4,365 $223,400 $31,200 $192,200
Source: Public Records

Map