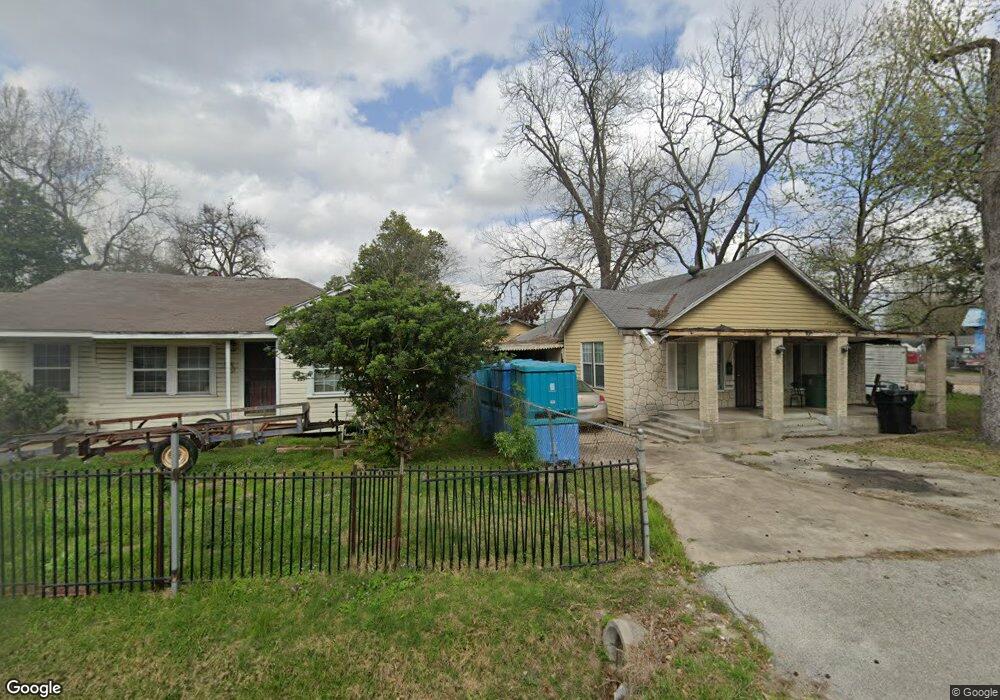
93 De Boll St Houston, TX 77022
Northside-Northline NeighborhoodEstimated Value: $287,000
3
Beds
2
Baths
2,123
Sq Ft
$135/Sq Ft
Est. Value
About This Home
This home is located at 93 De Boll St, Houston, TX 77022 and is currently estimated at $287,000, approximately $135 per square foot. 93 De Boll St is a home located in Harris County with nearby schools including Burbank Elementary School, Burbank Middle School, and Sam Houston Math, Science & Technology Center.
Ownership History
Date
Name
Owned For
Owner Type
Purchase Details
Closed on
Oct 8, 2005
Sold by
Escutia Nicolas R
Bought by
Chavez Cecilia
Current Estimated Value
Home Financials for this Owner
Home Financials are based on the most recent Mortgage that was taken out on this home.
Original Mortgage
$45,000
Interest Rate
4.3%
Mortgage Type
New Conventional
Purchase Details
Closed on
Feb 27, 1995
Sold by
Deleon Hector M and Deleon Nieves
Bought by
Escutia Nicolas R and Escutia Cecilia
Home Financials for this Owner
Home Financials are based on the most recent Mortgage that was taken out on this home.
Original Mortgage
$53,200
Interest Rate
9%
Create a Home Valuation Report for This Property
The Home Valuation Report is an in-depth analysis detailing your home's value as well as a comparison with similar homes in the area
Home Values in the Area
Average Home Value in this Area
Purchase History
| Date | Buyer | Sale Price | Title Company |
|---|---|---|---|
| Chavez Cecilia | -- | None Available | |
| Escutia Nicolas R | -- | First American Title |
Source: Public Records
Mortgage History
| Date | Status | Borrower | Loan Amount |
|---|---|---|---|
| Previous Owner | Chavez Cecilia | $45,000 | |
| Previous Owner | Escutia Nicolas R | $53,200 |
Source: Public Records
Tax History Compared to Growth
Tax History
| Year | Tax Paid | Tax Assessment Tax Assessment Total Assessment is a certain percentage of the fair market value that is determined by local assessors to be the total taxable value of land and additions on the property. | Land | Improvement |
|---|---|---|---|---|
| 2025 | $4,258 | $269,665 | $86,231 | $183,434 |
| 2024 | $4,258 | $251,000 | $86,231 | $164,769 |
| 2023 | $4,258 | $169,578 | $86,231 | $83,347 |
| 2022 | $3,083 | $140,000 | $62,415 | $77,585 |
| 2021 | $3,263 | $140,000 | $62,415 | $77,585 |
| 2020 | $3,712 | $153,290 | $62,415 | $90,875 |
| 2019 | $2,758 | $108,975 | $40,097 | $68,878 |
| 2018 | $2,697 | $106,589 | $43,116 | $63,473 |
| 2017 | $2,695 | $106,589 | $43,116 | $63,473 |
| 2016 | $2,654 | $104,974 | $43,116 | $61,858 |
| 2015 | $2,630 | $102,292 | $43,116 | $59,176 |
| 2014 | $2,630 | $102,292 | $43,116 | $59,176 |
Source: Public Records
Map
Nearby Homes
- 90 Burress St Unit B
- 90 Burress St Unit A
- 70 Burress St
- 108 Fichter St
- 61 Trenwood Ln
- 44 Farrell St
- 216 Burress St
- 45 Wellford St
- 56 Wellford St
- 249 De Boll St
- 132 Grothe Ln
- 253 De Boll St
- 9625 Fulton St
- 91 Burbank St
- 202 Burbank St
- 318 Charlock St
- 110 Luetta St
- 108 Luetta St
- 106 Luetta St
- 104 Luetta St