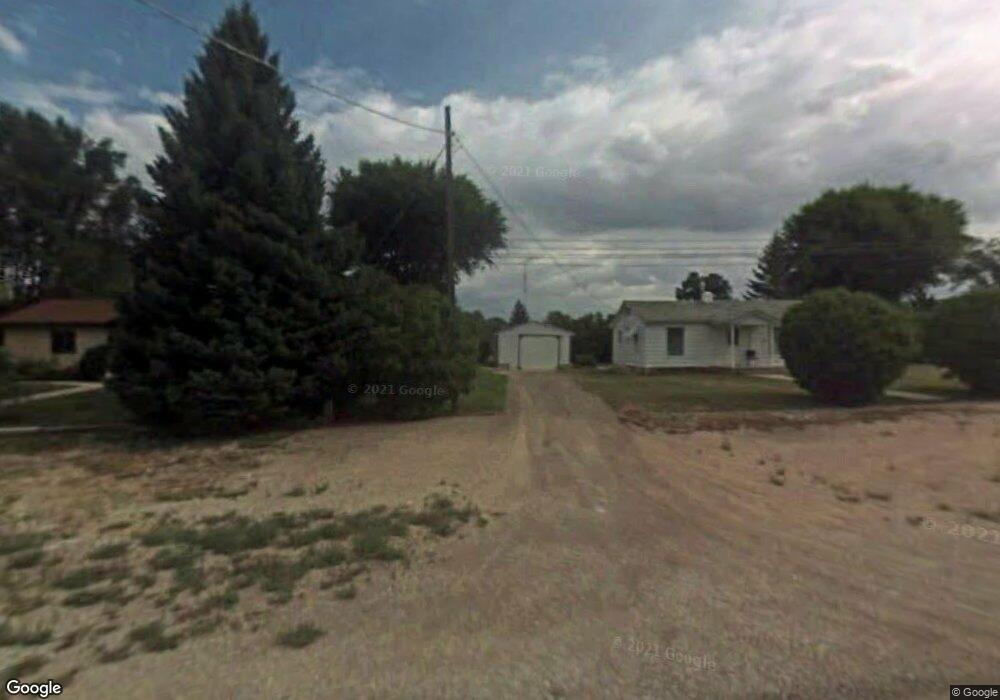
93 E 100 St S Sterling, UT 84665
Estimated Value: $237,000 - $262,000
2
Beds
1
Bath
810
Sq Ft
$314/Sq Ft
Est. Value
About This Home
This home is located at 93 E 100 St S, Sterling, UT 84665 and is currently estimated at $254,553, approximately $314 per square foot. 93 E 100 St S is a home located in Sanpete County.
Ownership History
Date
Name
Owned For
Owner Type
Purchase Details
Closed on
Sep 16, 2024
Sold by
Olsen David L
Bought by
Pipes Laura
Current Estimated Value
Home Financials for this Owner
Home Financials are based on the most recent Mortgage that was taken out on this home.
Original Mortgage
$198,400
Outstanding Balance
$190,838
Interest Rate
0.61%
Mortgage Type
Construction
Estimated Equity
$63,715
Create a Home Valuation Report for This Property
The Home Valuation Report is an in-depth analysis detailing your home's value as well as a comparison with similar homes in the area
Purchase History
We collect this data history from publicly available records. To have your information removed, we recommend requesting removal directly through your county’s website.
| Date | Buyer | Sale Price | Title Company |
|---|---|---|---|
| Pipes Laura | $248,000 | Professional Title Service |
Source: Public Records
Mortgage History
We collect this data history from publicly available records. To have your information removed, we recommend requesting removal directly through your county’s website.
| Date | Status | Borrower | Loan Amount |
|---|---|---|---|
| Open | Pipes Laura | $198,400 |
Source: Public Records
Tax History
| Year | Tax Paid | Tax Assessment Tax Assessment Total Assessment is a certain percentage of the fair market value that is determined by local assessors to be the total taxable value of land and additions on the property. | Land | Improvement |
|---|---|---|---|---|
| 2025 | $1,705 | $176,125 | $0 | $0 |
| 2024 | $1,654 | $162,821 | $0 | $0 |
| 2023 | $1,407 | $130,717 | $0 | $0 |
| 2022 | $1,300 | $110,462 | $0 | $0 |
| 2021 | $1,246 | $91,649 | $0 | $0 |
| 2020 | $1,167 | $80,883 | $0 | $0 |
| 2019 | $636 | $43,414 | $0 | $0 |
| 2018 | $554 | $66,732 | $23,760 | $42,972 |
| 2017 | $521 | $36,703 | $0 | $0 |
| 2016 | $488 | $34,389 | $0 | $0 |
| 2015 | $489 | $34,389 | $0 | $0 |
| 2014 | $479 | $34,389 | $0 | $0 |
| 2013 | $477 | $34,485 | $0 | $0 |
Source: Public Records
Map
Nearby Homes
- 117 E 250 S
- 315 E Jensen Ln
- 4925 S 1620 W
- 4835 S 1580 W Unit 9
- 1311 S 500 W
- 1283 S 500 W
- 1331 S Lowry Hill Rd
- 1218 S 500 W Unit 8
- 1255 S 500 W Unit 8
- 1168 S 500 W Unit 1
- 1205 S 500 W Unit 4
- 1292 S 500 W Unit 11
- 1337 S 500 W Unit 14
- 1322 S 500 W Unit 13
- 1177 S 500 W Unit 2
- 1192 S 500 W Unit 3
- 1231 S 500 W Unit 6
- 1268 S 500 W Unit 9
- 353 W 600 South St
- 335 W 600 South St
Your Personal Tour Guide
Ask me questions while you tour the home.