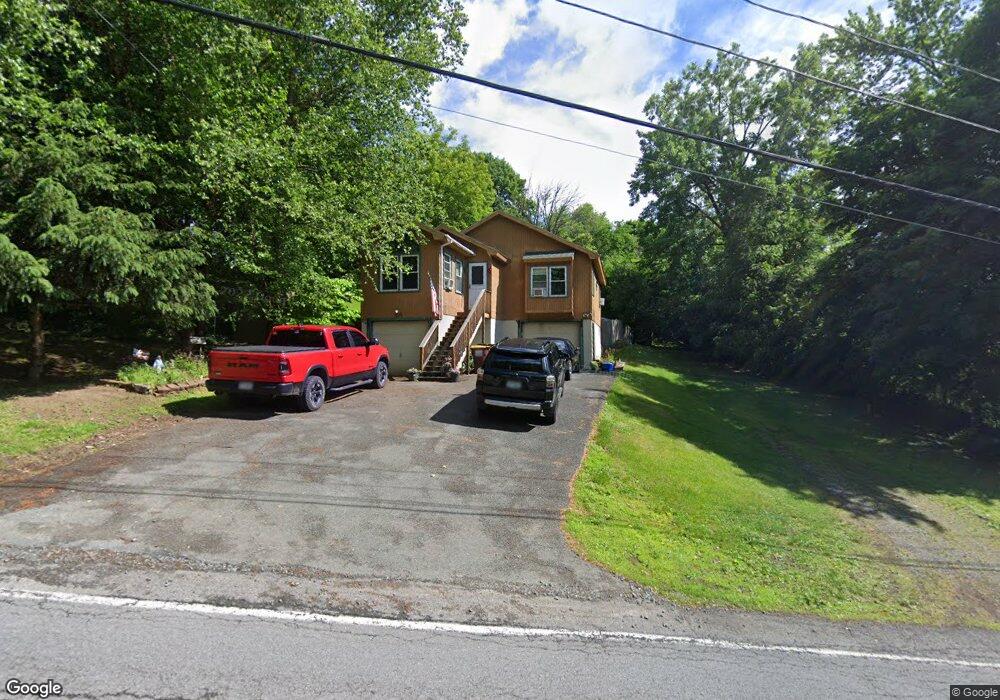
93 Elm St Watervliet, NY 12189
Estimated Value: $313,000 - $390,000
3
Beds
1
Bath
1,244
Sq Ft
$281/Sq Ft
Est. Value
About This Home
This home is located at 93 Elm St, Watervliet, NY 12189 and is currently estimated at $349,401, approximately $280 per square foot. 93 Elm St is a home located in Albany County with nearby schools including Latham Ridge School, Shaker Junior High School, and Shaker High School.
Ownership History
Date
Name
Owned For
Owner Type
Purchase Details
Closed on
Mar 24, 1999
Sold by
Fendrick Burce R and Fendrick Brenda M
Bought by
Denault Doreen and Weidman Robert J
Current Estimated Value
Home Financials for this Owner
Home Financials are based on the most recent Mortgage that was taken out on this home.
Original Mortgage
$101,948
Outstanding Balance
$24,737
Interest Rate
6.78%
Mortgage Type
FHA
Estimated Equity
$324,664
Purchase Details
Closed on
Nov 15, 1993
Sold by
Vinett Mark and Vinett Anitta
Bought by
Fendrick Bruce
Create a Home Valuation Report for This Property
The Home Valuation Report is an in-depth analysis detailing your home's value as well as a comparison with similar homes in the area
Home Values in the Area
Average Home Value in this Area
Purchase History
| Date | Buyer | Sale Price | Title Company |
|---|---|---|---|
| Denault Doreen | $102,000 | -- | |
| Fendrick Bruce | $97,400 | -- |
Source: Public Records
Mortgage History
| Date | Status | Borrower | Loan Amount |
|---|---|---|---|
| Open | Denault Doreen | $101,948 |
Source: Public Records
Tax History Compared to Growth
Tax History
| Year | Tax Paid | Tax Assessment Tax Assessment Total Assessment is a certain percentage of the fair market value that is determined by local assessors to be the total taxable value of land and additions on the property. | Land | Improvement |
|---|---|---|---|---|
| 2024 | $4,411 | $102,000 | $25,000 | $77,000 |
| 2023 | $4,354 | $102,000 | $25,000 | $77,000 |
| 2022 | $4,256 | $102,000 | $25,000 | $77,000 |
| 2021 | $4,238 | $102,000 | $25,000 | $77,000 |
| 2020 | $3,847 | $102,000 | $25,000 | $77,000 |
| 2019 | $2,070 | $102,000 | $25,000 | $77,000 |
| 2018 | $3,587 | $102,000 | $25,000 | $77,000 |
| 2017 | $0 | $102,000 | $25,000 | $77,000 |
| 2016 | $3,477 | $102,000 | $25,000 | $77,000 |
| 2015 | -- | $102,000 | $25,000 | $77,000 |
| 2014 | -- | $102,000 | $25,000 | $77,000 |
Source: Public Records
Map
Nearby Homes