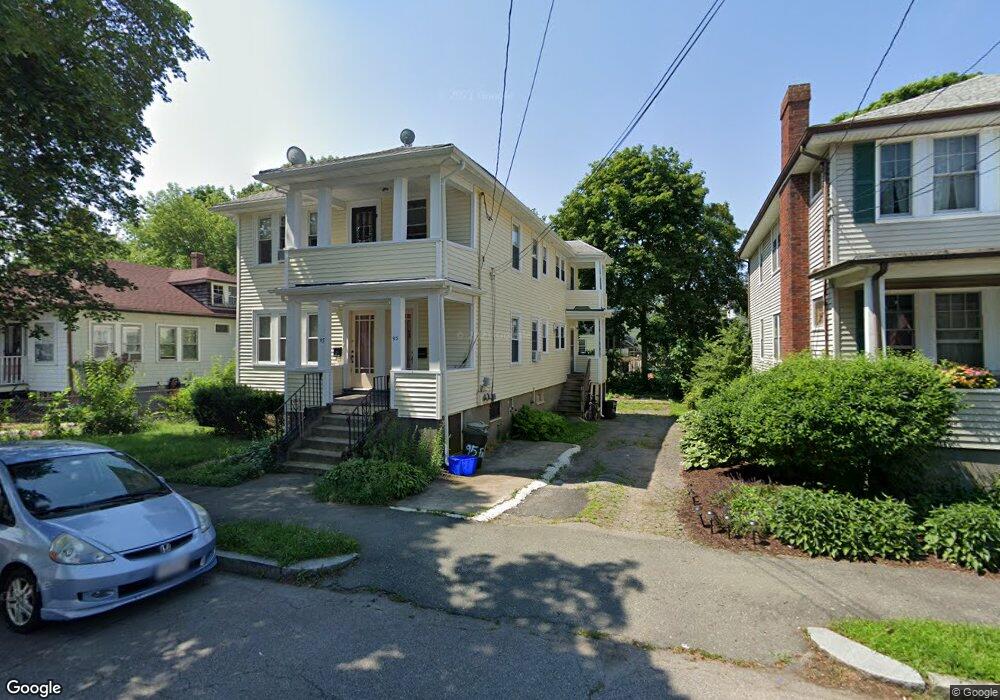
93 Farrington St Quincy, MA 02170
Montclair NeighborhoodEstimated Value: $746,000 - $1,013,000
4
Beds
2
Baths
2,100
Sq Ft
$402/Sq Ft
Est. Value
About This Home
This home is located at 93 Farrington St, Quincy, MA 02170 and is currently estimated at $844,779, approximately $402 per square foot. 93 Farrington St is a home located in Norfolk County with nearby schools including Montclair Elementary School, Atlantic Middle School, and North Quincy High School.
Ownership History
Date
Name
Owned For
Owner Type
Purchase Details
Closed on
Dec 31, 1996
Sold by
Carnali Albert D
Bought by
Lee Ga W and Lee Caroline Xf
Current Estimated Value
Home Financials for this Owner
Home Financials are based on the most recent Mortgage that was taken out on this home.
Original Mortgage
$65,000
Outstanding Balance
$6,931
Interest Rate
7.55%
Mortgage Type
Purchase Money Mortgage
Estimated Equity
$837,848
Purchase Details
Closed on
Aug 3, 1989
Sold by
Carnali Eleanor R
Bought by
Carnali Albert D
Home Financials for this Owner
Home Financials are based on the most recent Mortgage that was taken out on this home.
Original Mortgage
$100,000
Interest Rate
10%
Mortgage Type
Purchase Money Mortgage
Create a Home Valuation Report for This Property
The Home Valuation Report is an in-depth analysis detailing your home's value as well as a comparison with similar homes in the area
Home Values in the Area
Average Home Value in this Area
Purchase History
| Date | Buyer | Sale Price | Title Company |
|---|---|---|---|
| Lee Ga W | $160,000 | -- | |
| Carnali Albert D | $125,000 | -- |
Source: Public Records
Mortgage History
| Date | Status | Borrower | Loan Amount |
|---|---|---|---|
| Open | Carnali Albert D | $65,000 | |
| Previous Owner | Carnali Albert D | $98,000 | |
| Previous Owner | Carnali Albert D | $100,000 |
Source: Public Records
Tax History Compared to Growth
Tax History
| Year | Tax Paid | Tax Assessment Tax Assessment Total Assessment is a certain percentage of the fair market value that is determined by local assessors to be the total taxable value of land and additions on the property. | Land | Improvement |
|---|---|---|---|---|
| 2025 | $8,450 | $732,900 | $342,600 | $390,300 |
| 2024 | $8,127 | $721,100 | $342,600 | $378,500 |
| 2023 | $7,714 | $693,100 | $326,300 | $366,800 |
| 2022 | $7,465 | $623,100 | $283,800 | $339,300 |
| 2021 | $7,428 | $611,900 | $270,300 | $341,600 |
| 2020 | $7,402 | $595,500 | $270,300 | $325,200 |
| 2019 | $7,029 | $560,100 | $252,600 | $307,500 |
| 2018 | $6,637 | $497,500 | $233,900 | $263,600 |
| 2017 | $6,826 | $481,700 | $222,700 | $259,000 |
| 2016 | $6,048 | $421,200 | $193,700 | $227,500 |
| 2015 | $5,722 | $391,900 | $176,100 | $215,800 |
| 2014 | $5,002 | $336,600 | $167,700 | $168,900 |
Source: Public Records
Map
Nearby Homes
- 143 Arlington St
- 115 W Squantum St Unit 907
- 115 W Squantum St Unit 810
- 250 Fayette St
- 17 Holmes St Unit 2
- 17 Holmes St Unit 4
- 522 Hancock St
- 129-131 Pine St
- 323 Farrington St
- 11 Earle St
- 169 Pine St
- 45 Marion St
- 85 E Squantum St Unit 10
- 171 Milton St
- 121 Hillside Ave
- 101 Beach St
- 51 Denmark Ave
- 100 Grandview Ave Unit 11A
- 6 Warwick St
- 111 Warren Ave Unit 1F
- 89 Farrington St
- 101 Farrington St
- 85 Farrington St
- 105 Farrington St
- 82 Safford St
- 78 Safford St
- 86 Safford St
- 86 Safford St Unit 2
- 86 Safford St Unit 1
- 96 Farrington St
- 76 Safford St Unit 1
- 83 Farrington St Unit 4
- 83 Farrington St Unit 2
- 83 Farrington St Unit 1
- 83 Farrington St Unit 5
- 83 Farrington St Unit 3
- 100 Farrington St
- 92 Farrington St
- 107 Farrington St
- 74 Safford St