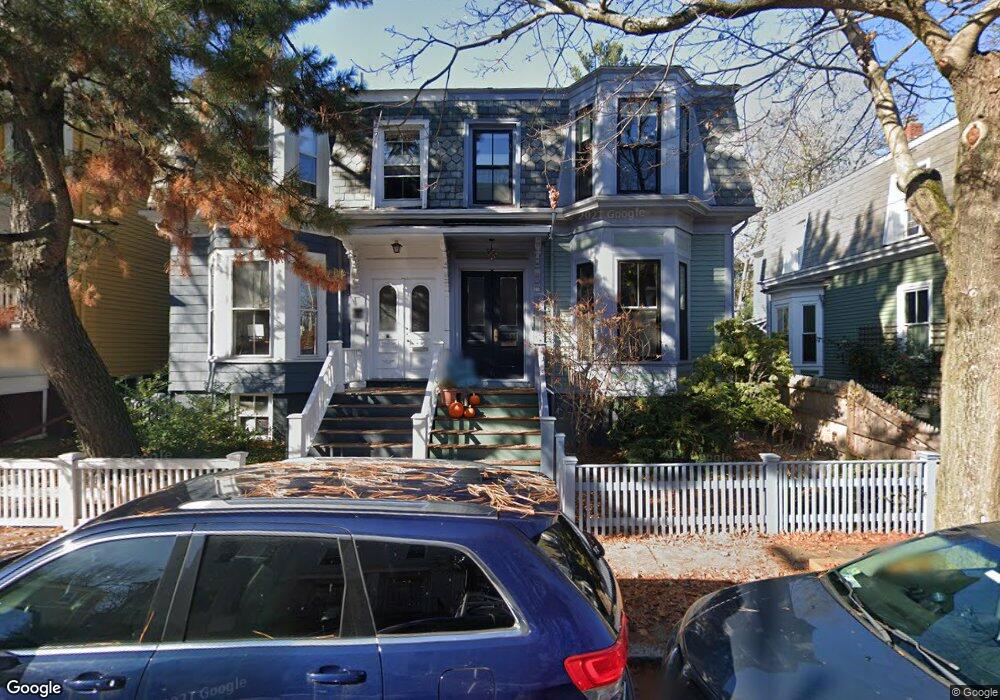
93 Inman St Cambridge, MA 02139
Mid-Cambridge NeighborhoodEstimated Value: $1,521,000 - $1,743,351
3
Beds
2
Baths
1,713
Sq Ft
$945/Sq Ft
Est. Value
About This Home
This home is located at 93 Inman St, Cambridge, MA 02139 and is currently estimated at $1,618,838, approximately $945 per square foot. 93 Inman St is a home located in Middlesex County with nearby schools including Prospect Hill Academy Charter School and Saint Paul's Choir School.
Ownership History
Date
Name
Owned For
Owner Type
Purchase Details
Closed on
May 21, 2019
Sold by
Goldenson Jeffrey D and Dean Natalie R
Bought by
Goldenson Dean 2019 Ret
Current Estimated Value
Purchase Details
Closed on
Nov 24, 2009
Sold by
Gough Jan and Malin Seamus
Bought by
Goldenson Jeffrey Douglas and Dean Natalie Ruth
Home Financials for this Owner
Home Financials are based on the most recent Mortgage that was taken out on this home.
Original Mortgage
$187,000
Interest Rate
4.86%
Mortgage Type
Purchase Money Mortgage
Purchase Details
Closed on
Mar 30, 1990
Sold by
Kluver Roland
Bought by
Gough Jan
Home Financials for this Owner
Home Financials are based on the most recent Mortgage that was taken out on this home.
Original Mortgage
$170,250
Interest Rate
9.96%
Mortgage Type
Purchase Money Mortgage
Create a Home Valuation Report for This Property
The Home Valuation Report is an in-depth analysis detailing your home's value as well as a comparison with similar homes in the area
Home Values in the Area
Average Home Value in this Area
Purchase History
| Date | Buyer | Sale Price | Title Company |
|---|---|---|---|
| Goldenson Dean 2019 Ret | -- | -- | |
| Goldenson Jeffrey Douglas | $587,000 | -- | |
| Gough Jan | $227,000 | -- | |
| Gough Jan | $227,000 | -- |
Source: Public Records
Mortgage History
| Date | Status | Borrower | Loan Amount |
|---|---|---|---|
| Previous Owner | Goldenson Jeffrey Douglas | $187,000 | |
| Previous Owner | Gough Jan | $159,800 | |
| Previous Owner | Gough Jan | $170,250 | |
| Previous Owner | Gough Jan | $97,500 |
Source: Public Records
Tax History Compared to Growth
Tax History
| Year | Tax Paid | Tax Assessment Tax Assessment Total Assessment is a certain percentage of the fair market value that is determined by local assessors to be the total taxable value of land and additions on the property. | Land | Improvement |
|---|---|---|---|---|
| 2025 | $9,086 | $1,430,900 | $764,500 | $666,400 |
| 2024 | $8,684 | $1,466,900 | $828,800 | $638,100 |
| 2023 | $8,044 | $1,372,700 | $824,100 | $548,600 |
| 2022 | $7,230 | $1,343,200 | $857,300 | $485,900 |
| 2021 | $7,230 | $1,235,900 | $781,900 | $454,000 |
| 2020 | $6,873 | $1,195,300 | $764,800 | $430,500 |
| 2019 | $6,365 | $1,071,500 | $671,800 | $399,700 |
| 2018 | $6,230 | $990,500 | $607,200 | $383,300 |
| 2017 | $6,184 | $952,800 | $594,300 | $358,500 |
| 2016 | $5,808 | $830,900 | $498,700 | $332,200 |
| 2015 | $5,699 | $728,800 | $431,500 | $297,300 |
| 2014 | $5,575 | $665,300 | $372,000 | $293,300 |
Source: Public Records
Map
Nearby Homes
- 114 Inman St Unit 3
- 75 Fayette St Unit 3
- 142 Amory St Unit Front
- 196 Prospect St
- 190 Prospect St Unit 8
- 31 Tremont St
- 305 Broadway
- 280 Harvard St Unit 1A
- 276 Harvard St Unit 7
- 33 Beacon St
- 8 Chatham St Unit 4
- 244 Norfolk St Unit 244
- 30 Bigelow St Unit B
- 33 Inman St Unit 1B
- 28 Inman St Unit 4
- 31 Houghton St Unit B
- 31 Houghton St Unit A
- 63 Oak St Unit 3
- 63 Oak St Unit 2
- 329 Harvard St Unit 1
- 91 Inman St Unit A
- 91 Inman St
- 91 1/2 Inman St
- 95 Inman St
- 97 Inman St Unit 1
- 97 Inman St Unit 97A
- 89 Inman St
- 90.5 Inman St Unit 4
- 90.5 Inman St Unit 2
- 66 Antrim St
- 70 Antrim St
- 68 Antrim St
- 62 Antrim St
- 62 Antrim St Unit 1
- 74 Antrim St Unit 3
- 74 Antrim St Unit 2
- 74 Antrim St Unit 1
- 72 Antrim St
- 72 Antrim St Unit 1
- 72 Antrim St Unit 2