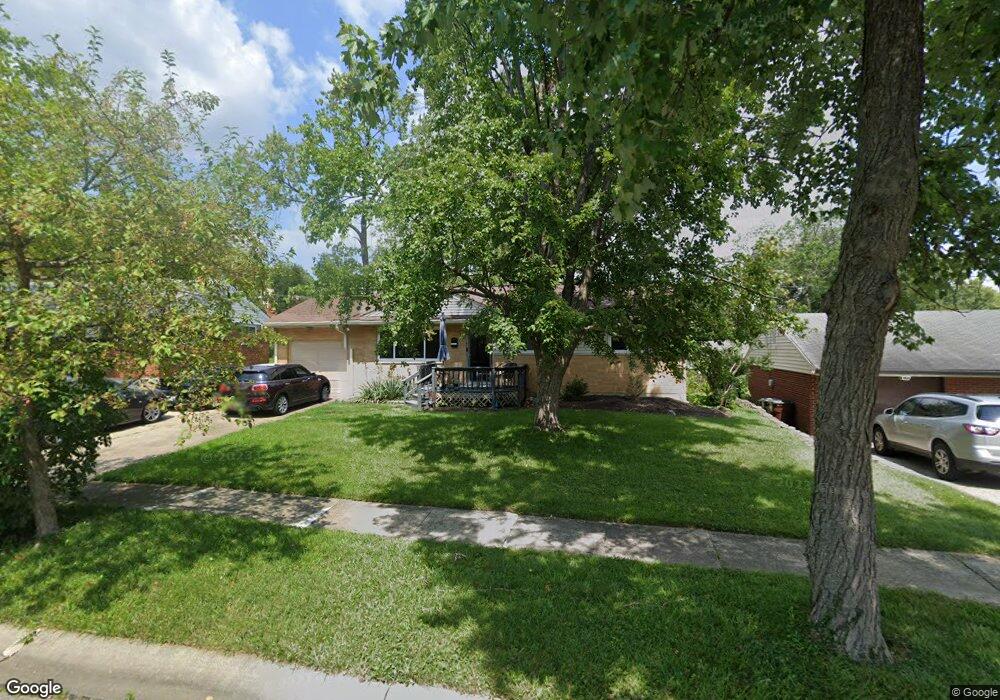
93 Julep Ln Cincinnati, OH 45218
Estimated Value: $246,756 - $262,000
4
Beds
2
Baths
1,667
Sq Ft
$151/Sq Ft
Est. Value
About This Home
This home is located at 93 Julep Ln, Cincinnati, OH 45218 and is currently estimated at $251,689, approximately $150 per square foot. 93 Julep Ln is a home located in Hamilton County with nearby schools including Calvary Academy- The.
Ownership History
Date
Name
Owned For
Owner Type
Purchase Details
Closed on
Aug 24, 2006
Sold by
Faig David E and Faig Paula S
Bought by
Crary Aaron Charles
Current Estimated Value
Home Financials for this Owner
Home Financials are based on the most recent Mortgage that was taken out on this home.
Original Mortgage
$124,300
Outstanding Balance
$73,217
Interest Rate
6.7%
Mortgage Type
Unknown
Estimated Equity
$178,472
Purchase Details
Closed on
Oct 26, 1996
Sold by
Messinger Michael and Messinger Charlene
Bought by
Faig David E and Faig Paula S
Home Financials for this Owner
Home Financials are based on the most recent Mortgage that was taken out on this home.
Original Mortgage
$77,000
Interest Rate
8.26%
Create a Home Valuation Report for This Property
The Home Valuation Report is an in-depth analysis detailing your home's value as well as a comparison with similar homes in the area
Home Values in the Area
Average Home Value in this Area
Purchase History
| Date | Buyer | Sale Price | Title Company |
|---|---|---|---|
| Crary Aaron Charles | $124,000 | Royal Land Title Agency Ltd | |
| Faig David E | $88,000 | -- |
Source: Public Records
Mortgage History
| Date | Status | Borrower | Loan Amount |
|---|---|---|---|
| Open | Crary Aaron Charles | $124,300 | |
| Previous Owner | Faig David E | $77,000 |
Source: Public Records
Tax History
| Year | Tax Paid | Tax Assessment Tax Assessment Total Assessment is a certain percentage of the fair market value that is determined by local assessors to be the total taxable value of land and additions on the property. | Land | Improvement |
|---|---|---|---|---|
| 2025 | $4,868 | $67,379 | $10,056 | $57,323 |
| 2024 | $4,488 | $67,379 | $10,056 | $57,323 |
| 2023 | $4,189 | $67,379 | $10,056 | $57,323 |
| 2022 | $3,919 | $47,058 | $7,802 | $39,256 |
| 2021 | $3,839 | $47,058 | $7,802 | $39,256 |
| 2020 | $3,895 | $47,058 | $7,802 | $39,256 |
| 2019 | $3,786 | $40,219 | $6,668 | $33,551 |
| 2018 | $3,795 | $40,219 | $6,668 | $33,551 |
| 2017 | $3,517 | $40,219 | $6,668 | $33,551 |
| 2016 | $3,279 | $36,607 | $7,207 | $29,400 |
| 2015 | $3,080 | $36,607 | $7,207 | $29,400 |
| 2014 | $3,152 | $36,607 | $7,207 | $29,400 |
| 2013 | $3,331 | $39,788 | $7,833 | $31,955 |
Source: Public Records
Map
Nearby Homes
- 16 Japonica Dr
- 1 Jennings Rd
- 34 Gambier Cir
- 10766 Chelmsford Rd
- 29 Dayspring Terrace
- 31 Flanders Ln
- 65 Drummond St
- 11 Dewitt Ct
- 9 Dewitt Ct
- 7 Dewitt Ct
- 6 Chalmers Ct
- 1105 Inner Circle Dr
- 626 Brightview Place Unit 24
- 624 Brightview Place Unit 25
- 48 Damon Rd
- 622 Brightview Place Unit 26
- 620 Brightview Place Unit 27
- 614 Brightview Place Unit 29
- 602 Brightview Place Unit 34
- 612 Brightview Place Unit 30
Your Personal Tour Guide
Ask me questions while you tour the home.