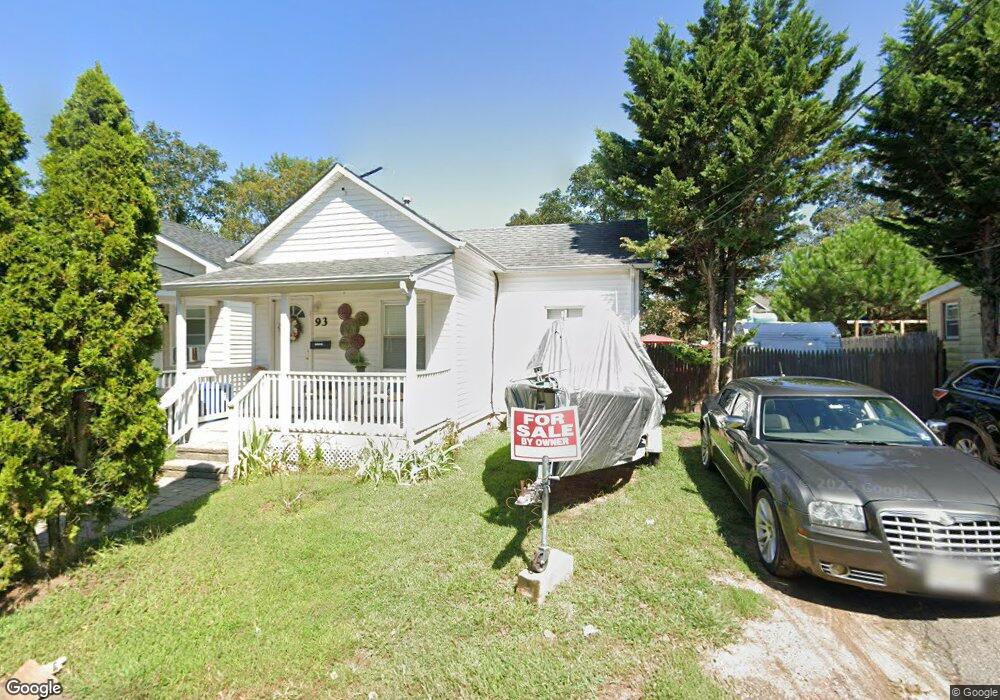
93 Laurel St Long Branch, NJ 07740
Estimated Value: $303,000 - $457,000
2
Beds
1
Bath
680
Sq Ft
$580/Sq Ft
Est. Value
About This Home
This home is located at 93 Laurel St, Long Branch, NJ 07740 and is currently estimated at $394,081, approximately $579 per square foot. 93 Laurel St is a home located in Monmouth County with nearby schools including Long Branch High School and Holy Trinity School.
Ownership History
Date
Name
Owned For
Owner Type
Purchase Details
Closed on
Feb 28, 2020
Sold by
Costa Julio and Laelia Llc
Bought by
Abraham Kenneth
Current Estimated Value
Purchase Details
Closed on
Sep 26, 2006
Sold by
Seelamsetty Prabhaker
Bought by
Costa Julio T
Home Financials for this Owner
Home Financials are based on the most recent Mortgage that was taken out on this home.
Original Mortgage
$192,000
Interest Rate
9.83%
Mortgage Type
Adjustable Rate Mortgage/ARM
Purchase Details
Closed on
Jan 31, 1997
Sold by
Fauntleroy Thomas
Bought by
Bradley John
Purchase Details
Closed on
Jan 30, 1997
Sold by
Papke Rolf
Bought by
Fauntleroy Thomas
Purchase Details
Closed on
Jan 25, 1996
Sold by
Bankers Savings
Bought by
Papke Rolf
Home Financials for this Owner
Home Financials are based on the most recent Mortgage that was taken out on this home.
Original Mortgage
$18,000
Interest Rate
7.25%
Create a Home Valuation Report for This Property
The Home Valuation Report is an in-depth analysis detailing your home's value as well as a comparison with similar homes in the area
Home Values in the Area
Average Home Value in this Area
Purchase History
| Date | Buyer | Sale Price | Title Company |
|---|---|---|---|
| Abraham Kenneth | $139,000 | None Available | |
| Costa Julio T | $240,000 | -- | |
| Bradley John | $70,000 | -- | |
| Fauntleroy Thomas | $40,000 | -- | |
| Papke Rolf | $20,000 | -- |
Source: Public Records
Mortgage History
| Date | Status | Borrower | Loan Amount |
|---|---|---|---|
| Previous Owner | Costa Julio T | $192,000 | |
| Previous Owner | Papke Rolf | $18,000 |
Source: Public Records
Tax History Compared to Growth
Tax History
| Year | Tax Paid | Tax Assessment Tax Assessment Total Assessment is a certain percentage of the fair market value that is determined by local assessors to be the total taxable value of land and additions on the property. | Land | Improvement |
|---|---|---|---|---|
| 2025 | $3,437 | $297,700 | $194,000 | $103,700 |
| 2024 | $3,247 | $223,600 | $124,400 | $99,200 |
| 2023 | $3,247 | $209,100 | $114,400 | $94,700 |
| 2022 | $2,961 | $160,400 | $77,000 | $83,400 |
| 2021 | $2,961 | $148,000 | $70,000 | $78,000 |
| 2020 | $2,855 | $136,600 | $59,000 | $77,600 |
| 2019 | $2,752 | $130,900 | $57,000 | $73,900 |
| 2018 | $2,668 | $126,200 | $55,000 | $71,200 |
| 2017 | $2,574 | $124,900 | $55,000 | $69,900 |
| 2016 | $2,528 | $125,100 | $57,000 | $68,100 |
| 2015 | $3,009 | $135,100 | $60,000 | $75,100 |
| 2014 | $2,880 | $136,300 | $69,600 | $66,700 |
Source: Public Records
Map
Nearby Homes
- 148 Sixth Ave
- 151 N 5th Ave
- 184 N 5th Ave
- 401 Joline Ave
- 190 Spruce St Unit 4
- 211 Rockwell Ave
- 40 N 5th Ave
- 40 University Dr
- 14 Slocum Place
- 39 Slocum Place
- 222 Coleman Ave
- 119 Washington St
- 565 Joline Ave
- 572 Jay St
- 145 Stokes Place
- 143 Stokes Place
- 399 Willow Ave
- 188 Chelton Ave
- 167 Chelsea Ave
- 323 Florence Ave
- 95 Laurel St Unit 97
- 91 Laurel St
- 94b Laurel St
- 117 Laurel St
- 89 Laurel St
- 92 Laurel St
- 94 Laurel St Unit B
- 94 Laurel St
- 124 6th Ave
- 128 6th Ave
- 120 6th Ave
- 121 Laurel St
- 103 Lippincott Ave
- 132 6th Ave
- 116 6th Ave
- 101 Lippincott Ave
- 115 Lippincott Ave
- 109 Lippincott Ave
- 111 Lippincott Ave
- 99 Lippincott Ave