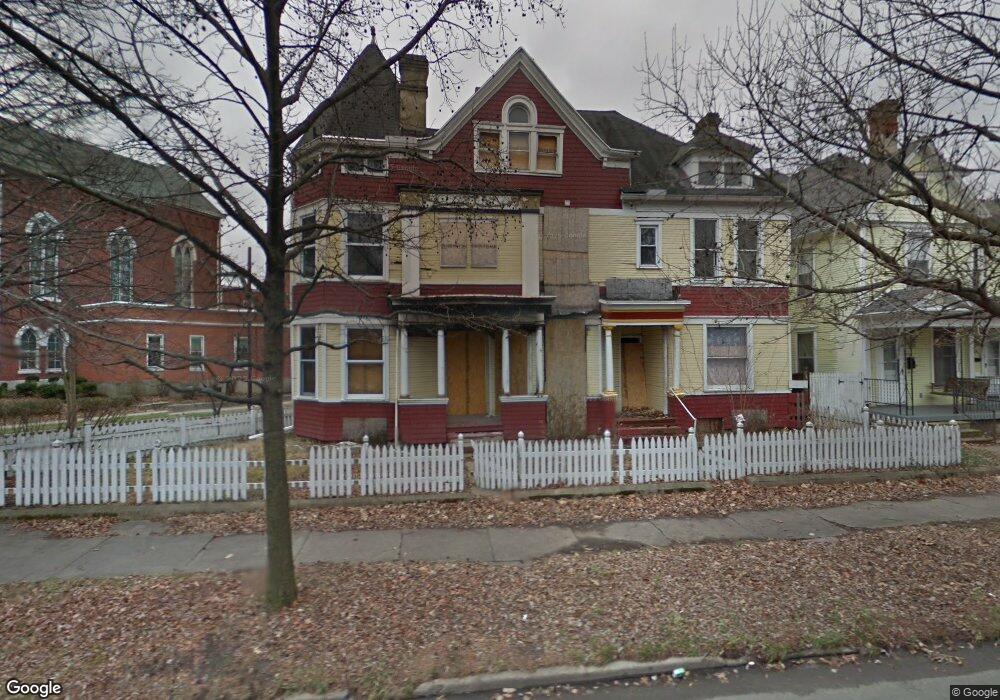
93 Linden Ave Dayton, OH 45403
Historic Inner East NeighborhoodEstimated Value: $170,196 - $266,000
5
Beds
2
Baths
4,413
Sq Ft
$52/Sq Ft
Est. Value
About This Home
This home is located at 93 Linden Ave, Dayton, OH 45403 and is currently estimated at $229,299, approximately $51 per square foot. 93 Linden Ave is a home located in Montgomery County with nearby schools including Ruskin Elementary School, Kiser Elementary, and Horizon Science Academy Dayton Downtown.
Ownership History
Date
Name
Owned For
Owner Type
Purchase Details
Closed on
Aug 30, 2016
Sold by
Paredes Ricardo and Paredes Rosalinda
Bought by
Paredes Raul
Current Estimated Value
Purchase Details
Closed on
Jul 22, 2016
Sold by
93 95 Linden Llc
Bought by
Paredes Ricardo and Paredes Rosallinda
Purchase Details
Closed on
Feb 18, 2016
Sold by
Millward Bradley N
Bought by
93 95 Linden Llc
Purchase Details
Closed on
Sep 30, 2014
Sold by
Steiner Delmar
Bought by
Millward Bradley N R
Purchase Details
Closed on
Nov 7, 2013
Sold by
Snider Marika and Dalley Marika
Bought by
Steiner Delmar
Purchase Details
Closed on
Dec 15, 1999
Sold by
Wagner Lowell and Wagner Liane
Bought by
Dalley Marika E
Home Financials for this Owner
Home Financials are based on the most recent Mortgage that was taken out on this home.
Original Mortgage
$73,150
Interest Rate
7.87%
Create a Home Valuation Report for This Property
The Home Valuation Report is an in-depth analysis detailing your home's value as well as a comparison with similar homes in the area
Home Values in the Area
Average Home Value in this Area
Purchase History
| Date | Buyer | Sale Price | Title Company |
|---|---|---|---|
| Paredes Raul | $3,000 | None Available | |
| Paredes Ricardo | $10,000 | None Available | |
| 93 95 Linden Llc | $10,000 | None Available | |
| Millward Bradley N R | $19,200 | None Available | |
| Steiner Delmar | $100 | None Available | |
| Dalley Marika E | $77,000 | -- |
Source: Public Records
Mortgage History
| Date | Status | Borrower | Loan Amount |
|---|---|---|---|
| Previous Owner | Dalley Marika E | $73,150 |
Source: Public Records
Tax History Compared to Growth
Tax History
| Year | Tax Paid | Tax Assessment Tax Assessment Total Assessment is a certain percentage of the fair market value that is determined by local assessors to be the total taxable value of land and additions on the property. | Land | Improvement |
|---|---|---|---|---|
| 2024 | $1,961 | $32,290 | $2,140 | $30,150 |
| 2023 | $1,961 | $32,290 | $2,140 | $30,150 |
| 2022 | $2,453 | $31,610 | $2,100 | $29,510 |
| 2021 | $2,406 | $31,610 | $2,100 | $29,510 |
| 2020 | $2,419 | $31,610 | $2,100 | $29,510 |
| 2019 | $1,128 | $6,730 | $2,100 | $4,630 |
| 2018 | $729 | $6,730 | $2,100 | $4,630 |
| 2017 | $722 | $6,730 | $2,100 | $4,630 |
| 2016 | $817 | $6,690 | $2,100 | $4,590 |
| 2015 | $1,198 | $6,690 | $2,100 | $4,590 |
| 2014 | $1,198 | $6,690 | $2,100 | $4,590 |
| 2012 | -- | $37,670 | $2,100 | $35,570 |
Source: Public Records
Map
Nearby Homes
- 60 Bell St
- 44 Bell St
- 44 Springfield St
- 2126 E 4th St
- 78 Huffman Ave Unit 76
- 35 Huffman Ave
- 2341 E 5th St
- 0 Huffman Ave
- 1820 E 4th St
- 1802 E 3rd St
- 57 S Torrence St
- 241 Linden Ave
- 150 Stainton Ave
- 21 Boltin St Unit 19
- 26 Boltin St Unit 26-28
- 28 Boltin St
- 62 Brenner Ave
- 41 Boltin St
- 1716 E 4th St
- 240 S Torrence St