93 Maluhia Dr Unit B Wailuku, HI 96793
Estimated Value: $645,000 - $722,104
3
Beds
1
Bath
930
Sq Ft
$732/Sq Ft
Est. Value
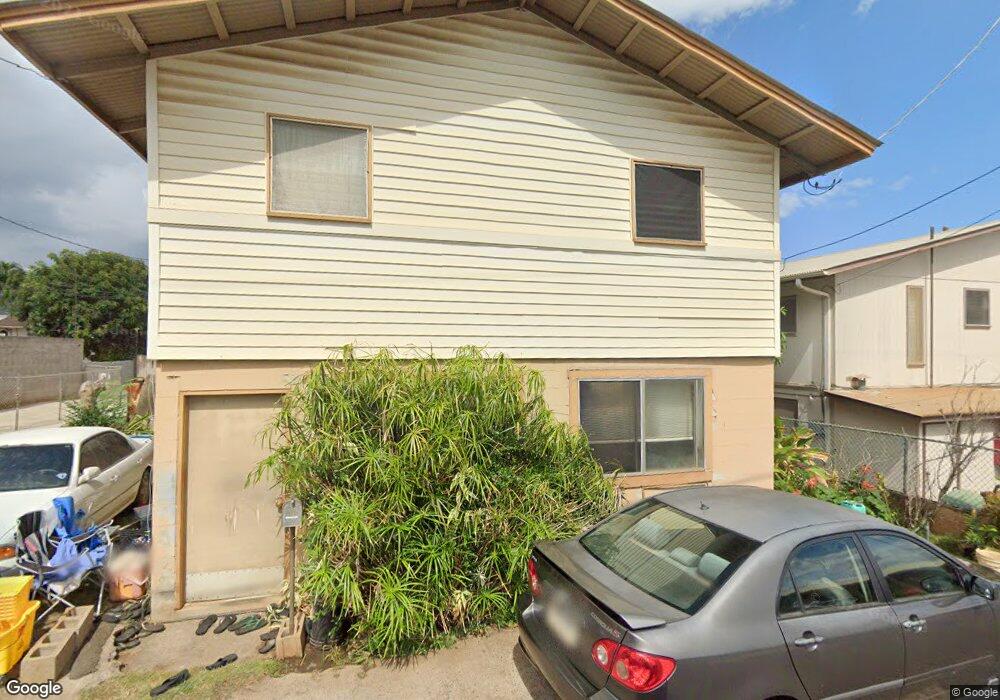
About This Home
This home is located at 93 Maluhia Dr Unit B, Wailuku, HI 96793 and is currently estimated at $681,026, approximately $732 per square foot. 93 Maluhia Dr Unit B is a home located in Maui County with nearby schools including Wailuku Elementary School, Iao Intermediate School, and Henry Perrine Baldwin High School.
Ownership History
Date
Name
Owned For
Owner Type
Purchase Details
Closed on
May 25, 2020
Sold by
Clifton Dennis E
Bought by
Roma Paloma Ana and Taula Kirifi Tyrone
Current Estimated Value
Home Financials for this Owner
Home Financials are based on the most recent Mortgage that was taken out on this home.
Original Mortgage
$316,000
Outstanding Balance
$280,632
Interest Rate
3.3%
Mortgage Type
New Conventional
Estimated Equity
$400,394
Purchase Details
Closed on
Mar 22, 2017
Sold by
Curley Christopher M and Curley Verli R
Bought by
Clifton Dennis E
Home Financials for this Owner
Home Financials are based on the most recent Mortgage that was taken out on this home.
Original Mortgage
$343,660
Interest Rate
4.37%
Mortgage Type
FHA
Purchase Details
Closed on
Dec 22, 2014
Sold by
Nishikatsu Utako and Johnson Utako M
Bought by
Curley Christopher M and Curley Verli R
Purchase Details
Closed on
Oct 28, 2002
Sold by
Makekau Stanley N B and Makekau Stanley
Bought by
Makekau Jeffery N
Create a Home Valuation Report for This Property
The Home Valuation Report is an in-depth analysis detailing your home's value as well as a comparison with similar homes in the area
Home Values in the Area
Average Home Value in this Area
Purchase History
| Date | Buyer | Sale Price | Title Company |
|---|---|---|---|
| Roma Paloma Ana | $395,000 | Fnt | |
| Clifton Dennis E | $350,000 | Or | |
| Curley Christopher M | $165,000 | Or | |
| Makekau Jeffery N | -- | -- |
Source: Public Records
Mortgage History
| Date | Status | Borrower | Loan Amount |
|---|---|---|---|
| Open | Roma Paloma Ana | $316,000 | |
| Previous Owner | Clifton Dennis E | $343,660 |
Source: Public Records
Tax History Compared to Growth
Tax History
| Year | Tax Paid | Tax Assessment Tax Assessment Total Assessment is a certain percentage of the fair market value that is determined by local assessors to be the total taxable value of land and additions on the property. | Land | Improvement |
|---|---|---|---|---|
| 2025 | $300 | $360,200 | $180,300 | $179,900 |
| 2024 | $300 | $329,100 | $157,400 | $171,700 |
| 2023 | $300 | $358,000 | $186,000 | $172,000 |
| 2022 | $350 | $305,000 | $148,800 | $156,200 |
| 2021 | $350 | $287,600 | $140,200 | $147,400 |
| 2020 | $400 | $290,600 | $140,200 | $150,400 |
| 2019 | $400 | $283,400 | $137,300 | $146,100 |
| 2018 | $400 | $302,500 | $131,600 | $170,900 |
| 2017 | $1,477 | $0 | $0 | $0 |
| 2016 | $1,339 | $202,900 | $128,800 | $74,100 |
| 2015 | $150 | $167,600 | $100,100 | $67,500 |
Source: Public Records
Map
Nearby Homes
- 1886 Loke St
- 1885 Main St Unit 508
- 1987 Olu Dr
- 2126 W Vineyard St
- 193 N Church St
- 2158 Main St Unit 707
- 257 S Market St
- 2180 W Vineyard St Unit 305
- 209 Muliwai Dr
- 171 Halenani Dr
- 372 N Market St
- 1982 Kalawi Place
- 366 Kapanui Place
- 1610 Wili Place
- 1791 Piihana Rd
- 281 Pua Kalaunu Loop
- 295 Pua Kalaunu Loop
- 2170 Kahawai St
- 91 Lunalilo St
- 376 Kalua Rd
- 93 Maluhia Dr
- 83 Maluhia Dr
- 92 Maluhia Dr
- 73A Maluhia Dr
- 72A Maluhia Dr
- 65 Maluhia Dr
- 64 Maluhia Dr
- 1939 E Vineyard St
- 1923A E Vineyard St
- 32 Central Ave
- 42 Maluhia Dr
- 81 Central Ave Unit D
- 81 Central Ave
- 30 Maluhia Dr
- 58 Central Ave
- 1942 Main St Unit 105 1/2
- 1967 E Vineyard St
- 1900 Main St Unit 4
- 1878 Loke St Unit 202
- 1878 Loke St