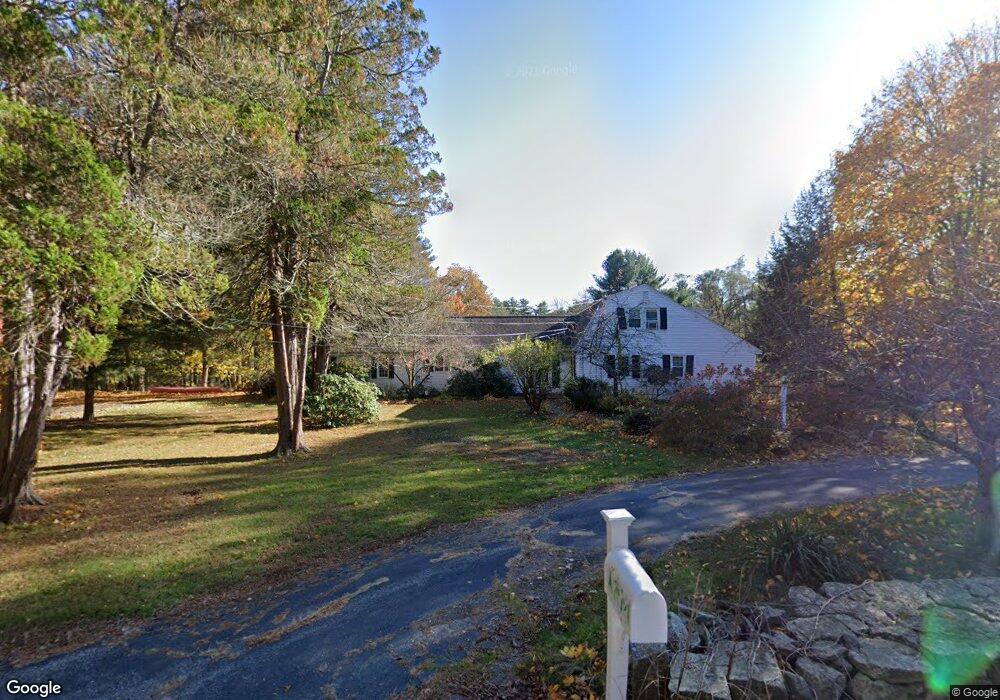
93 Moore Rd Sudbury, MA 01776
Estimated Value: $1,098,000 - $1,929,000
3
Beds
4
Baths
2,640
Sq Ft
$506/Sq Ft
Est. Value
About This Home
This home is located at 93 Moore Rd, Sudbury, MA 01776 and is currently estimated at $1,336,854, approximately $506 per square foot. 93 Moore Rd is a home located in Middlesex County with nearby schools including Peter Noyes Elementary School, Ephraim Curtis Middle School, and Lincoln-Sudbury Regional High School.
Ownership History
Date
Name
Owned For
Owner Type
Purchase Details
Closed on
Mar 16, 2012
Sold by
Pease Wendy M and Mackenzie Wendy E
Bought by
Kids Pease T and Pease Wendy M
Current Estimated Value
Purchase Details
Closed on
Apr 8, 2010
Sold by
Pease Franklin Stuart and Pease Wendy M
Bought by
Mackenzie Wendy E and Pease Wendy M
Purchase Details
Closed on
Jul 7, 2000
Sold by
Krieger Lawrence R and Krieger Virginia S
Bought by
Pease Franklin S and Pease Wendy M
Purchase Details
Closed on
May 28, 1993
Sold by
Hall Charles W and Hall Christine L
Bought by
Krieger Lawrence and Krieger Virginia S
Purchase Details
Closed on
Oct 5, 1987
Sold by
Reid Kenneth T
Bought by
Hall Charles W
Create a Home Valuation Report for This Property
The Home Valuation Report is an in-depth analysis detailing your home's value as well as a comparison with similar homes in the area
Home Values in the Area
Average Home Value in this Area
Purchase History
| Date | Buyer | Sale Price | Title Company |
|---|---|---|---|
| Kids Pease T | -- | -- | |
| Mackenzie Wendy E | -- | -- | |
| Pease Franklin S | $589,000 | -- | |
| Krieger Lawrence | $378,000 | -- | |
| Hall Charles W | $43,000 | -- |
Source: Public Records
Mortgage History
| Date | Status | Borrower | Loan Amount |
|---|---|---|---|
| Previous Owner | Hall Charles W | $450,000 | |
| Previous Owner | Hall Charles W | $290,000 |
Source: Public Records
Tax History
| Year | Tax Paid | Tax Assessment Tax Assessment Total Assessment is a certain percentage of the fair market value that is determined by local assessors to be the total taxable value of land and additions on the property. | Land | Improvement |
|---|---|---|---|---|
| 2025 | $14,302 | $976,900 | $460,800 | $516,100 |
| 2024 | $13,787 | $943,700 | $448,000 | $495,700 |
| 2023 | $13,133 | $832,800 | $416,400 | $416,400 |
| 2022 | $12,776 | $707,800 | $384,000 | $323,800 |
| 2021 | $12,390 | $658,000 | $384,000 | $274,000 |
| 2020 | $12,140 | $658,000 | $384,000 | $274,000 |
| 2019 | $11,785 | $658,000 | $384,000 | $274,000 |
| 2018 | $11,823 | $659,400 | $408,000 | $251,400 |
| 2017 | $11,325 | $638,400 | $389,200 | $249,200 |
| 2016 | $10,993 | $617,600 | $375,200 | $242,400 |
| 2015 | $10,551 | $599,500 | $361,600 | $237,900 |
| 2014 | $10,548 | $585,000 | $351,600 | $233,400 |
Source: Public Records
Map
Nearby Homes
- 21 Summer St
- 557 Dutton Rd Unit 2
- 15 Harness Ln
- 30 Harness Ln
- 30 Kendall Rd
- 45 Webster Cir
- 62 Churchill St
- 30 Rolling Ln
- 123 Dutton Rd
- 788 Main St
- 786 Main St
- 8 Shoreline Dr Unit 11
- 54 Stone Rd
- 14 Old County Rd Unit 21
- 3 Shore Line Dr Unit 15
- 10 Old County Rd Unit 19
- 1 Town Line Rd
- 1 Town Line Rd Unit 18
- 0 Robbins Rd
- 34 Hallock Point Rd
Your Personal Tour Guide
Ask me questions while you tour the home.