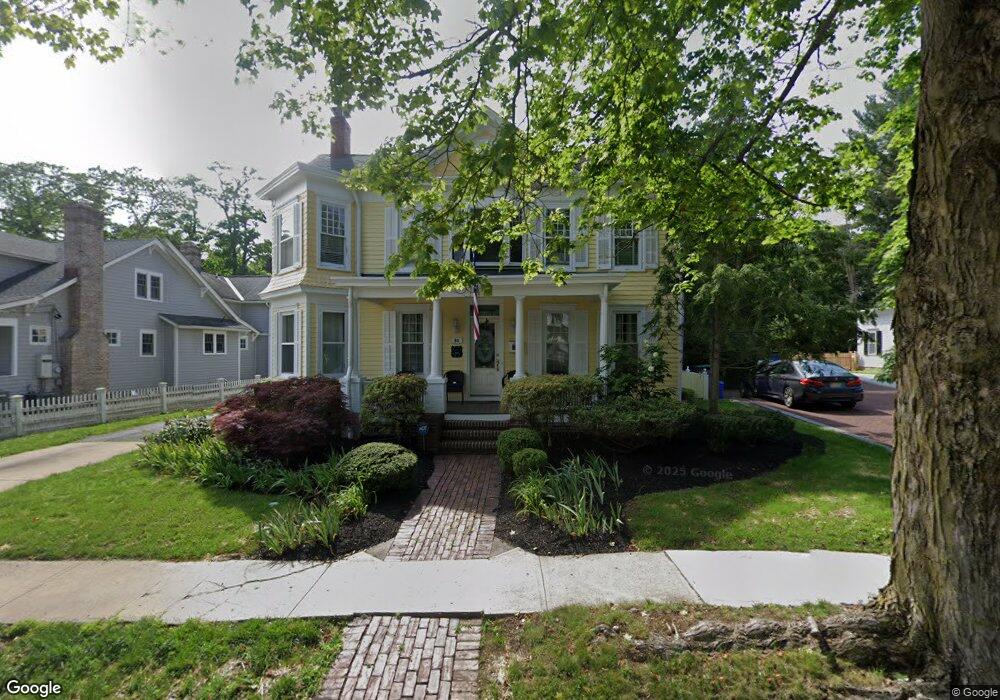
93 N Main St Unit none Cranbury, NJ 08512
Estimated Value: $946,000 - $1,229,000
4
Beds
3
Baths
3,674
Sq Ft
$288/Sq Ft
Est. Value
About This Home
This home is located at 93 N Main St Unit none, Cranbury, NJ 08512 and is currently estimated at $1,058,792, approximately $288 per square foot. 93 N Main St Unit none is a home located in Middlesex County with nearby schools including The Cranbury School, SciCore Academy, and E Windsor Knowledge Beginnings.
Ownership History
Date
Name
Owned For
Owner Type
Purchase Details
Closed on
Jul 30, 2015
Sold by
Horrigan Michael and Horrigan Mary
Bought by
Kunukkasseril Xavier
Current Estimated Value
Home Financials for this Owner
Home Financials are based on the most recent Mortgage that was taken out on this home.
Original Mortgage
$425,000
Outstanding Balance
$334,714
Interest Rate
4.07%
Mortgage Type
New Conventional
Estimated Equity
$724,078
Purchase Details
Closed on
Dec 12, 2001
Sold by
Strong Sally
Bought by
Horrigan Michael and Horrigan Mary
Home Financials for this Owner
Home Financials are based on the most recent Mortgage that was taken out on this home.
Original Mortgage
$275,000
Interest Rate
7.15%
Create a Home Valuation Report for This Property
The Home Valuation Report is an in-depth analysis detailing your home's value as well as a comparison with similar homes in the area
Home Values in the Area
Average Home Value in this Area
Purchase History
| Date | Buyer | Sale Price | Title Company |
|---|---|---|---|
| Kunukkasseril Xavier | $720,000 | Nrt Title Agency Llc | |
| Horrigan Michael | $545,000 | -- |
Source: Public Records
Mortgage History
| Date | Status | Borrower | Loan Amount |
|---|---|---|---|
| Open | Kunukkasseril Xavier | $425,000 | |
| Previous Owner | Horrigan Michael | $275,000 |
Source: Public Records
Tax History
| Year | Tax Paid | Tax Assessment Tax Assessment Total Assessment is a certain percentage of the fair market value that is determined by local assessors to be the total taxable value of land and additions on the property. | Land | Improvement |
|---|---|---|---|---|
| 2025 | $13,194 | $719,400 | $157,000 | $562,400 |
| 2024 | $13,007 | $719,400 | $157,000 | $562,400 |
Source: Public Records
Map
Nearby Homes
Your Personal Tour Guide
Ask me questions while you tour the home.