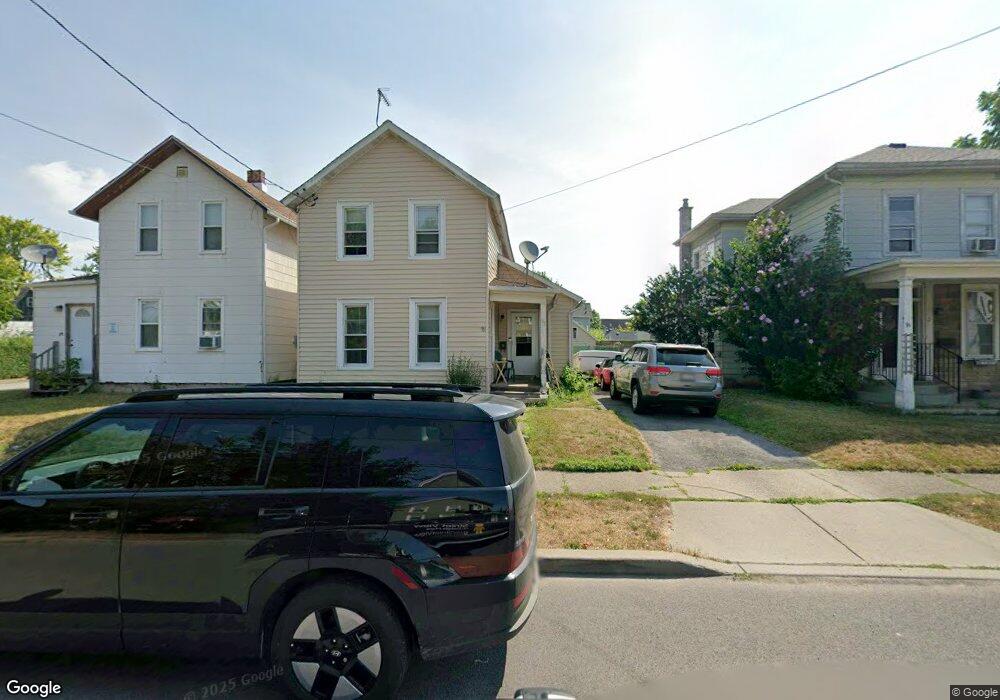
93 N Marion St North Tonawanda, NY 14120
Estimated Value: $114,000 - $219,000
3
Beds
1
Bath
1,664
Sq Ft
$104/Sq Ft
Est. Value
About This Home
This home is located at 93 N Marion St, North Tonawanda, NY 14120 and is currently estimated at $172,614, approximately $103 per square foot. 93 N Marion St is a home located in Niagara County with nearby schools including North Tonawanda Intermediate School and St Matthew Lutheran School.
Ownership History
Date
Name
Owned For
Owner Type
Purchase Details
Closed on
Feb 13, 2014
Sold by
Bars Kurt A and Bars Marcy Marie
Bought by
Bars Kurt A
Current Estimated Value
Home Financials for this Owner
Home Financials are based on the most recent Mortgage that was taken out on this home.
Original Mortgage
$76,250
Outstanding Balance
$57,976
Interest Rate
4.5%
Mortgage Type
New Conventional
Estimated Equity
$114,638
Purchase Details
Closed on
Mar 25, 2004
Sold by
Bars Kurt
Bought by
Bars Kurt
Purchase Details
Closed on
Oct 17, 1997
Sold by
Chatelle Marie R
Bought by
Mccarthy Marcy and Bars Kurt
Create a Home Valuation Report for This Property
The Home Valuation Report is an in-depth analysis detailing your home's value as well as a comparison with similar homes in the area
Home Values in the Area
Average Home Value in this Area
Purchase History
| Date | Buyer | Sale Price | Title Company |
|---|---|---|---|
| Bars Kurt A | -- | None Available | |
| Bars Kurt | -- | Anthony Mangiaracina | |
| Mccarthy Marcy | $52,000 | -- |
Source: Public Records
Mortgage History
| Date | Status | Borrower | Loan Amount |
|---|---|---|---|
| Open | Bars Kurt A | $76,250 |
Source: Public Records
Tax History Compared to Growth
Tax History
| Year | Tax Paid | Tax Assessment Tax Assessment Total Assessment is a certain percentage of the fair market value that is determined by local assessors to be the total taxable value of land and additions on the property. | Land | Improvement |
|---|---|---|---|---|
| 2024 | $2,366 | $67,000 | $14,800 | $52,200 |
| 2023 | $2,307 | $67,000 | $14,800 | $52,200 |
| 2022 | $1,833 | $67,000 | $14,800 | $52,200 |
| 2021 | $1,795 | $67,000 | $14,800 | $52,200 |
| 2020 | $1,710 | $67,000 | $14,800 | $52,200 |
| 2019 | $1,595 | $67,000 | $14,800 | $52,200 |
| 2018 | $1,646 | $67,000 | $14,800 | $52,200 |
| 2017 | $1,595 | $67,000 | $14,800 | $52,200 |
| 2016 | $1,532 | $67,000 | $14,800 | $52,200 |
| 2015 | -- | $67,000 | $14,800 | $52,200 |
| 2014 | -- | $67,000 | $14,800 | $52,200 |
Source: Public Records
Map
Nearby Homes