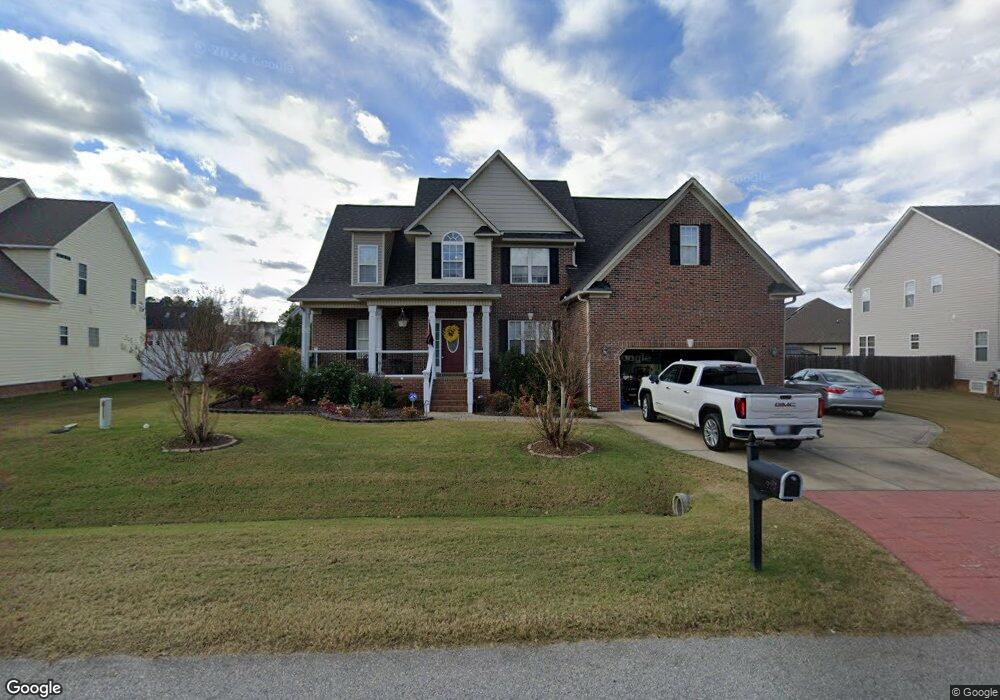
93 Neuse Landing Dr Clayton, NC 27527
Estimated Value: $447,526 - $492,000
4
Beds
3
Baths
2,707
Sq Ft
$173/Sq Ft
Est. Value
About This Home
This home is located at 93 Neuse Landing Dr, Clayton, NC 27527 and is currently estimated at $469,632, approximately $173 per square foot. 93 Neuse Landing Dr is a home located in Johnston County with nearby schools including Powhatan Elementary School, Riverwood Middle School, and Clayton High.
Ownership History
Date
Name
Owned For
Owner Type
Purchase Details
Closed on
Sep 12, 2018
Sold by
Peeples Mcarthur and Peeples Veronica Emily
Bought by
Xayaveth Sounetala and Xayaveth Sarah Elizabeth
Current Estimated Value
Home Financials for this Owner
Home Financials are based on the most recent Mortgage that was taken out on this home.
Original Mortgage
$284,747
Outstanding Balance
$248,445
Interest Rate
4.62%
Mortgage Type
FHA
Estimated Equity
$221,187
Purchase Details
Closed on
Jun 30, 2013
Sold by
Brown Jeffery M and Stapleton Paula M
Bought by
Peeples Mcarthur
Purchase Details
Closed on
May 4, 2007
Sold by
Homes By Greg Johnson Inc
Bought by
Brown Jeffery M and Stapleton Paula M
Home Financials for this Owner
Home Financials are based on the most recent Mortgage that was taken out on this home.
Original Mortgage
$267,100
Interest Rate
6.12%
Mortgage Type
Purchase Money Mortgage
Create a Home Valuation Report for This Property
The Home Valuation Report is an in-depth analysis detailing your home's value as well as a comparison with similar homes in the area
Home Values in the Area
Average Home Value in this Area
Purchase History
| Date | Buyer | Sale Price | Title Company |
|---|---|---|---|
| Xayaveth Sounetala | $290,000 | None Available | |
| Peeples Mcarthur | $250,000 | None Available | |
| Brown Jeffery M | $269,500 | None Available |
Source: Public Records
Mortgage History
| Date | Status | Borrower | Loan Amount |
|---|---|---|---|
| Open | Xayaveth Sounetala | $284,747 | |
| Previous Owner | Brown Jeffery M | $267,100 |
Source: Public Records
Tax History Compared to Growth
Tax History
| Year | Tax Paid | Tax Assessment Tax Assessment Total Assessment is a certain percentage of the fair market value that is determined by local assessors to be the total taxable value of land and additions on the property. | Land | Improvement |
|---|---|---|---|---|
| 2025 | $2,752 | $433,440 | $65,000 | $368,440 |
| 2024 | $2,254 | $278,240 | $45,000 | $233,240 |
| 2023 | $2,142 | $278,240 | $45,000 | $233,240 |
| 2022 | $2,198 | $278,240 | $45,000 | $233,240 |
| 2021 | $2,198 | $278,240 | $45,000 | $233,240 |
| 2020 | $2,282 | $278,240 | $45,000 | $233,240 |
| 2019 | $2,282 | $278,240 | $45,000 | $233,240 |
| 2018 | $0 | $241,580 | $40,000 | $201,580 |
| 2017 | $2,029 | $241,580 | $40,000 | $201,580 |
| 2016 | $2,029 | $241,580 | $40,000 | $201,580 |
| 2015 | $2,029 | $241,580 | $40,000 | $201,580 |
| 2014 | $2,029 | $241,580 | $40,000 | $201,580 |
Source: Public Records
Map
Nearby Homes
- 86 Sharpstone Ln
- 319 River Knoll Dr
- 81 Northcliff Ct
- 138 Claymore Dr
- 505 Vinson Rd
- 118 Christian St
- 30 Neuse Hollow Ct
- 66 Neuse Hollow Ct
- 102 Neuse Hollow Ct
- 49 Neuse Hollow Ct
- 90 Neuse Hollow Ct
- 371 Neuse Hollow Ct
- 18 Neuse Hollow Ct
- 387 Cascade Knoll Dr
- 630 Southerland Rd
- 119 Neuse Hollow Ct
- Blanco Plan at Neuse Ridge
- Palmer Plan at Neuse Ridge
- Durham Plan at Neuse Ridge
- Carolina Plan at Neuse Ridge
- 77 Neuse Landing Dr
- 19 Treewood Ln
- 31 Treewood Ln
- 98 Neuse Landing Dr
- 98 Neuse Landing Dr Unit 75
- 65 Neuse Landing Dr
- 65 Neuse Landing Dr Unit LT208
- 65 Neuse Landing Dr Unit L208
- 54 Westcliff Ct
- 78 Neuse Landing Dr
- 43 Treewood Ln
- 120 Neuse Landing Dr
- 53 Westcliff Ct
- 18 Treewood Ln
- 135 Neuse Landing Dr
- 45 Neuse Landing Dr
- 53 Treewood Ln
- 56 Neuse Landing Dr
- 144 Neuse Landing Dr
- 144 Neuse Landing Dr