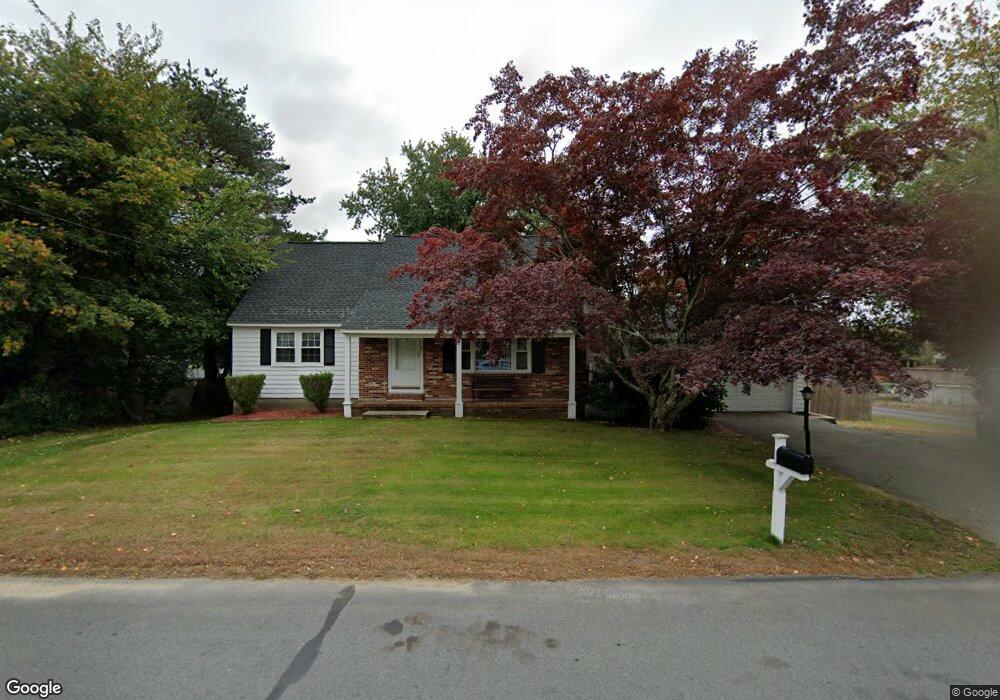
93 Pitman St Methuen, MA 01844
The East End NeighborhoodEstimated Value: $585,000 - $612,000
3
Beds
2
Baths
1,652
Sq Ft
$360/Sq Ft
Est. Value
About This Home
This home is located at 93 Pitman St, Methuen, MA 01844 and is currently estimated at $595,240, approximately $360 per square foot. 93 Pitman St is a home located in Essex County with nearby schools including Methuen High School, Community Day Charter Public School - Gateway, and Esperanza Academy School of Hope.
Ownership History
Date
Name
Owned For
Owner Type
Purchase Details
Closed on
Dec 5, 2024
Sold by
Fredette William A
Bought by
Waf Ret T Of 2024 and Fredette
Current Estimated Value
Purchase Details
Closed on
Jan 1, 1986
Bought by
Fredette William
Create a Home Valuation Report for This Property
The Home Valuation Report is an in-depth analysis detailing your home's value as well as a comparison with similar homes in the area
Home Values in the Area
Average Home Value in this Area
Purchase History
| Date | Buyer | Sale Price | Title Company |
|---|---|---|---|
| Waf Ret T Of 2024 | -- | None Available | |
| Waf Ret T Of 2024 | -- | None Available | |
| Waf Ret T Of 2024 | -- | None Available | |
| Fredette William | $153,500 | -- |
Source: Public Records
Mortgage History
| Date | Status | Borrower | Loan Amount |
|---|---|---|---|
| Previous Owner | Fredette William | $195,000 | |
| Previous Owner | Fredette William | $75,000 | |
| Previous Owner | Fredette William | $71,000 | |
| Previous Owner | Fredette William | $25,000 |
Source: Public Records
Tax History
| Year | Tax Paid | Tax Assessment Tax Assessment Total Assessment is a certain percentage of the fair market value that is determined by local assessors to be the total taxable value of land and additions on the property. | Land | Improvement |
|---|---|---|---|---|
| 2025 | $5,193 | $490,800 | $224,100 | $266,700 |
| 2024 | $5,116 | $471,100 | $204,400 | $266,700 |
| 2023 | $4,806 | $410,800 | $181,700 | $229,100 |
| 2022 | $4,556 | $349,100 | $151,400 | $197,700 |
| 2021 | $4,340 | $329,000 | $143,800 | $185,200 |
| 2020 | $4,355 | $324,000 | $143,800 | $180,200 |
| 2019 | $4,275 | $301,300 | $128,700 | $172,600 |
| 2018 | $4,193 | $293,800 | $128,700 | $165,100 |
| 2017 | $4,080 | $278,500 | $128,700 | $149,800 |
| 2016 | $3,822 | $258,100 | $121,100 | $137,000 |
| 2015 | $3,675 | $251,700 | $121,100 | $130,600 |
Source: Public Records
Map
Nearby Homes
- 35 Christopher Dr
- 60 Ames St
- 17 Ferry Rd
- 5 Pilgrim Cir Unit C
- 27 Russell Farm Dr
- 86 Comet Rd
- 30 Anderson Dr
- 128 Pleasant Valley St
- 183 Farrwood Dr
- 403 Farrwood Dr
- 68 Ashford St
- 21 Oak St Unit A
- 3 Thissell St
- 1 Riverview Blvd Unit 8-203
- 1 Riverview Blvd Unit 3-8
- 111 Ferry Rd Unit 111
- 41 Brookdale Ave
- 105 Ferry Rd
- 18 Erhardt Terrace
- 14 Magna Rd
Your Personal Tour Guide
Ask me questions while you tour the home.