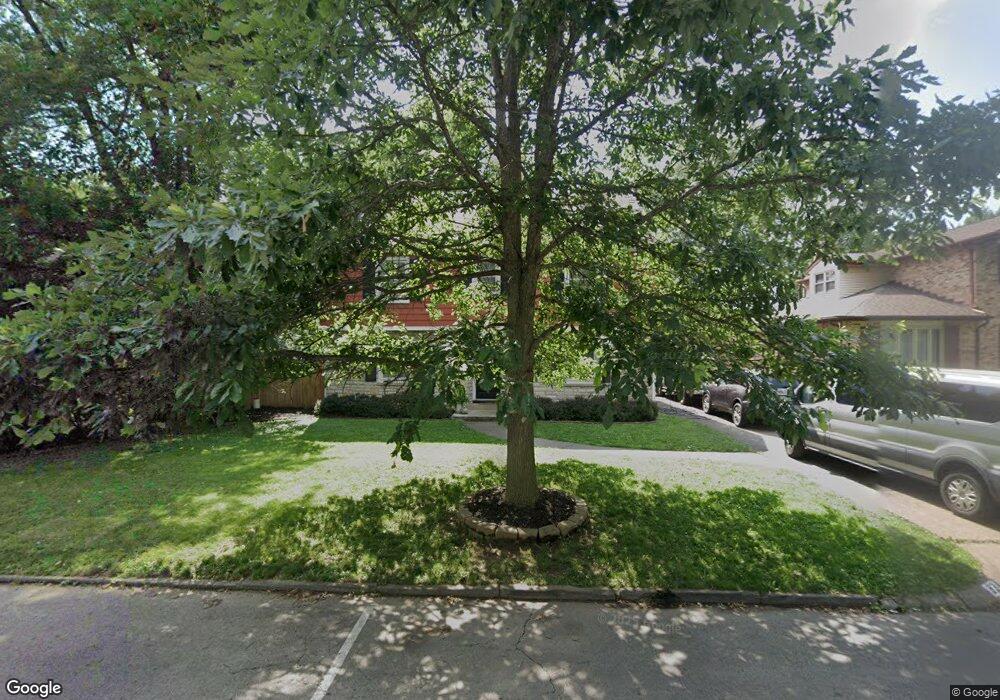
93 S Virginialee Rd Columbus, OH 43209
Eastmoor NeighborhoodEstimated Value: $522,000 - $561,327
4
Beds
5
Baths
2,423
Sq Ft
$224/Sq Ft
Est. Value
About This Home
This home is located at 93 S Virginialee Rd, Columbus, OH 43209 and is currently estimated at $543,082, approximately $224 per square foot. 93 S Virginialee Rd is a home located in Franklin County with nearby schools including Fairmoor Elementary School, Johnson Park Middle School, and Walnut Ridge High School.
Ownership History
Date
Name
Owned For
Owner Type
Purchase Details
Closed on
May 7, 2014
Sold by
Aiello Joseph A and Aiello Sara E
Bought by
Horn Timothy A and Horn Kelli A
Current Estimated Value
Home Financials for this Owner
Home Financials are based on the most recent Mortgage that was taken out on this home.
Original Mortgage
$184,000
Outstanding Balance
$140,648
Interest Rate
4.41%
Mortgage Type
New Conventional
Estimated Equity
$402,434
Purchase Details
Closed on
Sep 1, 2011
Sold by
Reynolds Lucinda A
Bought by
Aiello Joseph A and Aiello Sara E
Home Financials for this Owner
Home Financials are based on the most recent Mortgage that was taken out on this home.
Original Mortgage
$152,000
Interest Rate
4.58%
Mortgage Type
New Conventional
Purchase Details
Closed on
Aug 22, 1996
Sold by
Handy Robert F
Bought by
Lucinda A Reynolds
Home Financials for this Owner
Home Financials are based on the most recent Mortgage that was taken out on this home.
Original Mortgage
$164,350
Interest Rate
5.88%
Mortgage Type
New Conventional
Create a Home Valuation Report for This Property
The Home Valuation Report is an in-depth analysis detailing your home's value as well as a comparison with similar homes in the area
Home Values in the Area
Average Home Value in this Area
Purchase History
| Date | Buyer | Sale Price | Title Company |
|---|---|---|---|
| Horn Timothy A | $230,000 | None Available | |
| Aiello Joseph A | $190,000 | Independent | |
| Lucinda A Reynolds | $173,000 | -- |
Source: Public Records
Mortgage History
| Date | Status | Borrower | Loan Amount |
|---|---|---|---|
| Open | Horn Timothy A | $184,000 | |
| Previous Owner | Aiello Joseph A | $152,000 | |
| Previous Owner | Lucinda A Reynolds | $164,350 |
Source: Public Records
Tax History Compared to Growth
Tax History
| Year | Tax Paid | Tax Assessment Tax Assessment Total Assessment is a certain percentage of the fair market value that is determined by local assessors to be the total taxable value of land and additions on the property. | Land | Improvement |
|---|---|---|---|---|
| 2024 | $6,550 | $145,950 | $46,200 | $99,750 |
| 2023 | $6,466 | $145,950 | $46,200 | $99,750 |
| 2022 | $5,716 | $110,220 | $33,150 | $77,070 |
| 2021 | $5,727 | $110,220 | $33,150 | $77,070 |
| 2020 | $5,734 | $110,220 | $33,150 | $77,070 |
| 2019 | $5,281 | $87,050 | $26,530 | $60,520 |
| 2018 | $4,914 | $87,050 | $26,530 | $60,520 |
| 2017 | $5,150 | $87,050 | $26,530 | $60,520 |
| 2016 | $5,022 | $75,810 | $20,580 | $55,230 |
| 2015 | $4,559 | $75,810 | $20,580 | $55,230 |
| 2014 | $4,570 | $75,810 | $20,580 | $55,230 |
| 2013 | $2,254 | $75,810 | $20,580 | $55,230 |
Source: Public Records
Map
Nearby Homes
- 50 S Chesterfield Rd
- 47 N Chesterfield Rd
- 50 N Broadleigh Rd
- 142 S Gould Rd
- 239 S Kellner Rd
- 123 S Gould Rd
- 247 S James Rd
- 277 S James Rd
- 297 S James Rd
- 124 N Gould Rd
- 205 N Gould Rd
- 2731 E Broad St
- 2738 E Broad St
- 59 N Everett Ave
- 2717 E Broad St
- 184 S Hampton Rd
- 73 N Everett Ave
- 208 S Stanwood Rd
- 430 S James Rd
- 238 Edgevale Rd
- 93 S Virginia Lee Rd
- 101 S Virginialee Rd
- 85 S Virginialee Rd
- 85 S Virginia Lee Rd
- 107 S Virginia Lee Rd
- 75 S Virginialee Rd
- 75 S Virginia Lee Rd
- 115 S Virginialee Rd
- 115 S Virginialee Rd
- 88 S Harding Rd
- 96 S Harding Rd
- 78 S Harding Rd
- 104 S Virginialee Rd
- 67 S Virginialee Rd
- 108 S Virginia Lee Rd
- 123 S Virginia Lee Rd
- 85 Eastmoor Blvd
- 106 S Harding Rd
- 123 S Virginialee Rd
- 70 S Harding Rd