Estimated Value: $789,000 - $1,102,000
4
Beds
5
Baths
5,800
Sq Ft
$165/Sq Ft
Est. Value
About This Home
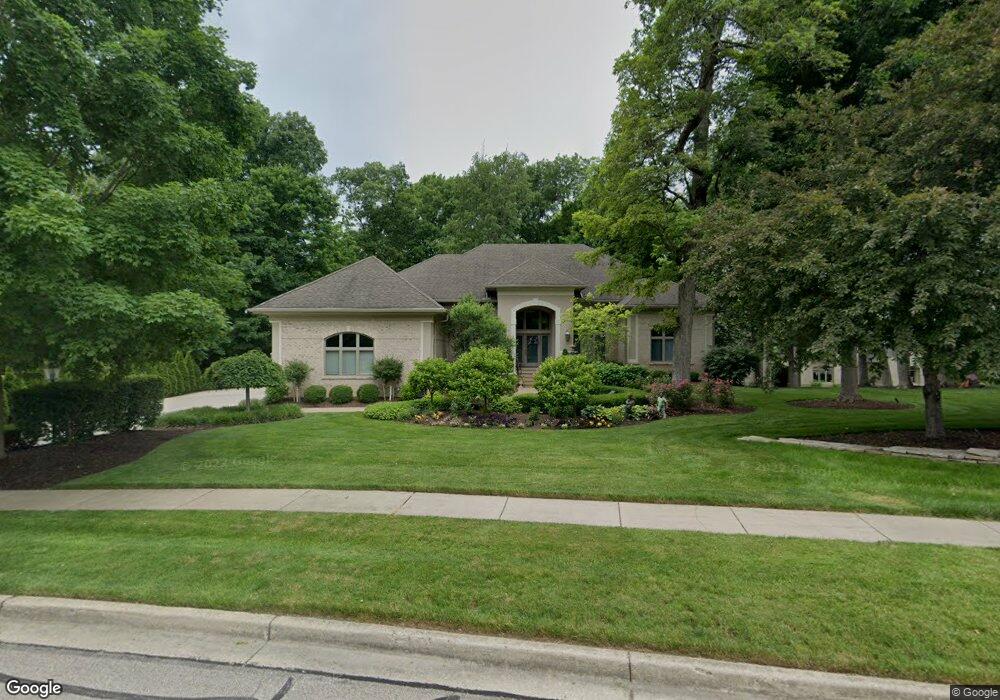
This home is located at 93 Signature Dr S, Xenia, OH 45385 and is currently estimated at $958,124, approximately $165 per square foot. 93 Signature Dr S is a home located in Greene County with nearby schools including Trebein Elementary School, Jacob Coy Middle School, and Beavercreek High School.
Ownership History
Date
Name
Owned For
Owner Type
Purchase Details
Closed on
Oct 15, 2013
Sold by
Chami Robert G and Yezbak Ramona T
Bought by
Harmeyer John P and John P Harmeyer Revocable Living Trust
Current Estimated Value
Home Financials for this Owner
Home Financials are based on the most recent Mortgage that was taken out on this home.
Original Mortgage
$100,500
Outstanding Balance
$74,779
Interest Rate
4.25%
Mortgage Type
Adjustable Rate Mortgage/ARM
Estimated Equity
$883,345
Purchase Details
Closed on
Jan 24, 2002
Sold by
Arnold Enterprises Inc
Bought by
Chami Robert G
Home Financials for this Owner
Home Financials are based on the most recent Mortgage that was taken out on this home.
Original Mortgage
$556,000
Interest Rate
5.25%
Purchase Details
Closed on
Feb 23, 1995
Sold by
Nbl Dev Group Ltd Ptns
Bought by
Arnold Enterprises Inc
Create a Home Valuation Report for This Property
The Home Valuation Report is an in-depth analysis detailing your home's value as well as a comparison with similar homes in the area
Home Values in the Area
Average Home Value in this Area
Purchase History
| Date | Buyer | Sale Price | Title Company |
|---|---|---|---|
| Harmeyer John P | $575,000 | None Available | |
| Chami Robert G | $695,000 | -- | |
| Arnold Enterprises Inc | $150,000 | -- |
Source: Public Records
Mortgage History
| Date | Status | Borrower | Loan Amount |
|---|---|---|---|
| Open | Harmeyer John P | $100,500 | |
| Previous Owner | Chami Robert G | $556,000 |
Source: Public Records
Tax History Compared to Growth
Tax History
| Year | Tax Paid | Tax Assessment Tax Assessment Total Assessment is a certain percentage of the fair market value that is determined by local assessors to be the total taxable value of land and additions on the property. | Land | Improvement |
|---|---|---|---|---|
| 2024 | $14,665 | $260,740 | $31,760 | $228,980 |
| 2023 | $14,665 | $260,740 | $31,760 | $228,980 |
| 2022 | $14,581 | $227,240 | $31,760 | $195,480 |
| 2021 | $14,726 | $227,240 | $31,760 | $195,480 |
| 2020 | $14,796 | $227,240 | $31,760 | $195,480 |
| 2019 | $15,282 | $215,500 | $33,050 | $182,450 |
| 2018 | $13,320 | $215,500 | $33,050 | $182,450 |
| 2017 | $12,783 | $215,500 | $33,050 | $182,450 |
| 2016 | $12,605 | $201,250 | $33,050 | $168,200 |
| 2015 | $12,684 | $201,250 | $33,050 | $168,200 |
| 2014 | $12,387 | $201,250 | $33,050 | $168,200 |
Source: Public Records
Map
Nearby Homes
- 139 Signature Dr S
- 463 Valhalla Ct
- 2353 Sherwood Ct
- 39 George Wythe Way
- 2284 Annandale Place
- 80 George Wythe Way
- Congressional Plan at Country Club of the North - Luxury Series
- Somerset Plan at Country Club of the North - Signature Series
- Addington Plan at Country Club of the North - Luxury Series
- Heatherwood Plan at Country Club of the North - Signature Series
- Savannah Plan at Country Club of the North - Luxury Series
- Crooked Stick Plan at Country Club of the North - Signature Series
- Breton Plan at Country Club of the North - Luxury Series
- Oakmont Plan at Country Club of the North - Signature Series
- Arcadia Plan at Country Club of the North - Luxury Series
- Shadow Creek Plan at Country Club of the North - Signature Series
- Rubicon Plan at Country Club of the North - Signature Series
- Southern Hills Plan at Country Club of the North - Luxury Series
- Equestrian Plan at Country Club of the North - Signature Series
- Medinah Plan at Country Club of the North - Signature Series
- 13 Signature Dr S
- 81 Lochinvar Ct
- 103 Signature Dr S
- 103 Signature Dr S
- 100 Signature Dr S
- 115 Signature Dr S
- 71 Lochinvar Ct
- 78 Lochinvar Ct
- 112 Signature Dr S
- 102 Castle Pine Ct
- 127 Signature Dr S
- 110 Castle Pine Ct
- 110 Castle Pines Ct
- 124 Signature Dr S
- 0 Signature Dr Unit 598734
- 122 Castle Pine Ct
- 100 Castle Pine Ct
- 134 Castle Pine Ct
- 136 Signature Dr S
- 66 Lochinvar Ct