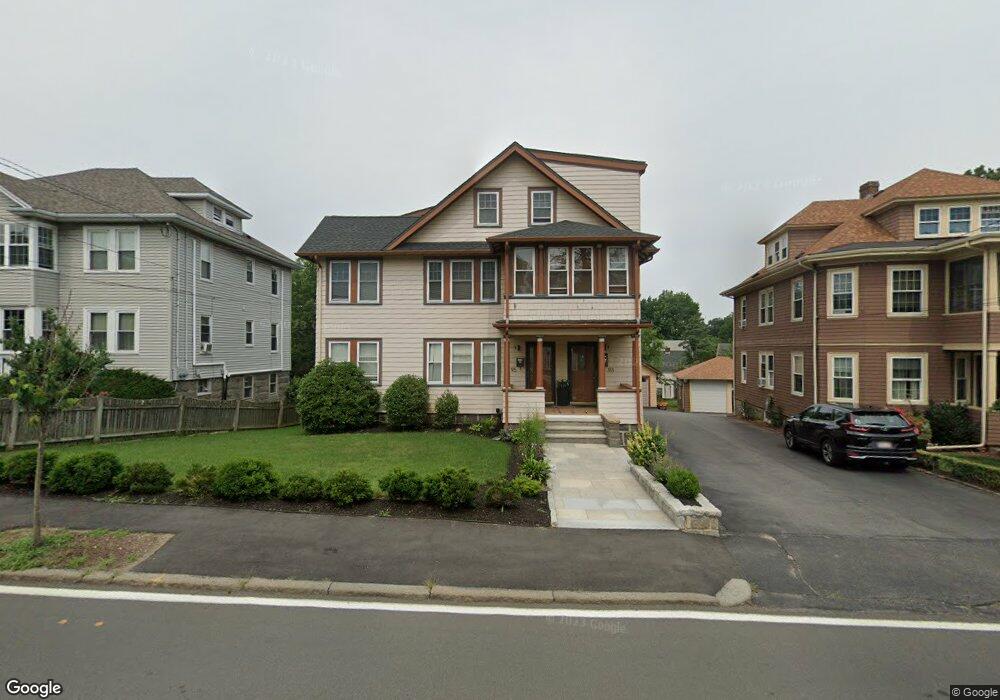
93 West St Quincy, MA 02169
South Quincy NeighborhoodEstimated Value: $787,000 - $1,034,000
6
Beds
3
Baths
2,964
Sq Ft
$316/Sq Ft
Est. Value
About This Home
This home is located at 93 West St, Quincy, MA 02169 and is currently estimated at $936,683, approximately $316 per square foot. 93 West St is a home located in Norfolk County with nearby schools including South West Middle School, Lincoln-Hancock Community School, and Quincy High School.
Ownership History
Date
Name
Owned For
Owner Type
Purchase Details
Closed on
Apr 8, 1997
Sold by
Lee Melvin Y and Lee Donna F
Bought by
Barbosa Rolando O
Current Estimated Value
Home Financials for this Owner
Home Financials are based on the most recent Mortgage that was taken out on this home.
Original Mortgage
$141,750
Outstanding Balance
$16,824
Interest Rate
7.5%
Mortgage Type
Purchase Money Mortgage
Estimated Equity
$919,859
Create a Home Valuation Report for This Property
The Home Valuation Report is an in-depth analysis detailing your home's value as well as a comparison with similar homes in the area
Home Values in the Area
Average Home Value in this Area
Purchase History
| Date | Buyer | Sale Price | Title Company |
|---|---|---|---|
| Barbosa Rolando O | $189,000 | -- |
Source: Public Records
Mortgage History
| Date | Status | Borrower | Loan Amount |
|---|---|---|---|
| Open | Barbosa Rolando O | $141,750 | |
| Previous Owner | Barbosa Rolando O | $11,100 |
Source: Public Records
Tax History Compared to Growth
Tax History
| Year | Tax Paid | Tax Assessment Tax Assessment Total Assessment is a certain percentage of the fair market value that is determined by local assessors to be the total taxable value of land and additions on the property. | Land | Improvement |
|---|---|---|---|---|
| 2025 | $10,813 | $937,800 | $321,300 | $616,500 |
| 2024 | $10,196 | $904,700 | $306,500 | $598,200 |
| 2023 | $9,537 | $856,900 | $279,700 | $577,200 |
| 2022 | $9,455 | $789,200 | $234,900 | $554,300 |
| 2021 | $9,628 | $793,100 | $234,900 | $558,200 |
| 2020 | $9,533 | $766,900 | $234,900 | $532,000 |
| 2019 | $9,096 | $724,800 | $222,300 | $502,500 |
| 2018 | $7,508 | $562,800 | $206,700 | $356,100 |
| 2017 | $7,574 | $534,500 | $197,300 | $337,200 |
| 2016 | $6,679 | $465,100 | $173,100 | $292,000 |
| 2015 | $6,571 | $450,100 | $173,100 | $277,000 |
| 2014 | $5,800 | $390,300 | $173,100 | $217,200 |
Source: Public Records
Map
Nearby Homes
- 42 West St
- 510 Willard St
- 211 West St Unit 12B
- 211 Copeland St
- 57 Buckley St
- 46-48 Buckley St
- 52 Bunker Hill Ln
- 14 Arthur Ave
- 12 Arthur Ave
- 21 Arthur St
- 46 Suomi Rd
- 46 Suomi Rd Unit 46
- 63 Adele Rd
- 91 Garfield St
- 64 Garfield St Unit B
- 1 Cityview Ln Unit 506
- 1 Cityview Ln Unit 210
- 1 Cityview Ln Unit 709
- 1 Cityview Ln Unit 204
- 21 Totman St Unit 202