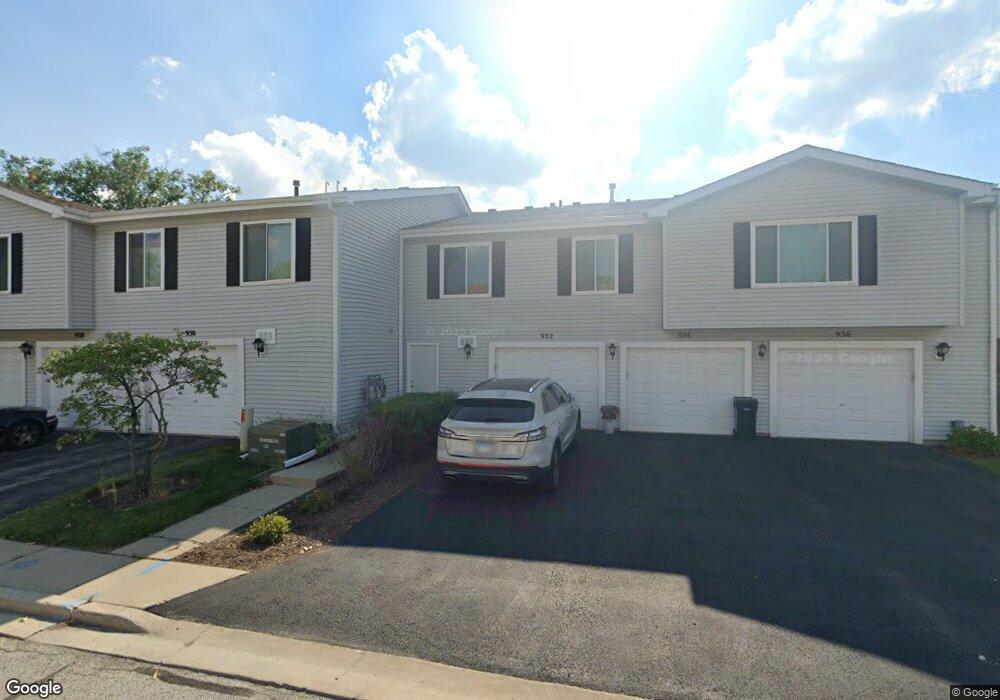
930 Adams Ct Unit 93 Vernon Hills, IL 60061
Estimated Value: $251,647 - $269,000
2
Beds
2
Baths
1,000
Sq Ft
$263/Sq Ft
Est. Value
About This Home
This home is located at 930 Adams Ct Unit 93, Vernon Hills, IL 60061 and is currently estimated at $262,912, approximately $262 per square foot. 930 Adams Ct Unit 93 is a home located in Lake County with nearby schools including Hawthorn School Of Dual Language, Hawthorn Townline Elementary School, and Hawthorn Middle School North.
Ownership History
Date
Name
Owned For
Owner Type
Purchase Details
Closed on
Aug 30, 2019
Sold by
Hanlon John
Bought by
Jani Yogeshkumar
Current Estimated Value
Purchase Details
Closed on
Dec 18, 2002
Sold by
Efflandt Scott M and Parmelee Dawn L
Bought by
Hanlon John
Home Financials for this Owner
Home Financials are based on the most recent Mortgage that was taken out on this home.
Original Mortgage
$123,200
Interest Rate
5.62%
Mortgage Type
Purchase Money Mortgage
Purchase Details
Closed on
May 31, 2002
Sold by
Parmelee Dawn L
Bought by
Parmelee Dawn L and Efflandt Scott M
Purchase Details
Closed on
Jun 23, 1998
Sold by
Cahill Daniel and Cahill Daniel J
Bought by
Parmelee Dawn L
Home Financials for this Owner
Home Financials are based on the most recent Mortgage that was taken out on this home.
Original Mortgage
$84,500
Interest Rate
7.27%
Mortgage Type
Purchase Money Mortgage
Create a Home Valuation Report for This Property
The Home Valuation Report is an in-depth analysis detailing your home's value as well as a comparison with similar homes in the area
Home Values in the Area
Average Home Value in this Area
Purchase History
| Date | Buyer | Sale Price | Title Company |
|---|---|---|---|
| Jani Yogeshkumar | $108,600 | Attorney | |
| Hanlon John | $154,000 | Multiple | |
| Parmelee Dawn L | -- | -- | |
| Parmelee Dawn L | $92,000 | 1St American Title |
Source: Public Records
Mortgage History
| Date | Status | Borrower | Loan Amount |
|---|---|---|---|
| Previous Owner | Hanlon John | $123,200 | |
| Previous Owner | Parmelee Dawn L | $84,500 |
Source: Public Records
Tax History Compared to Growth
Tax History
| Year | Tax Paid | Tax Assessment Tax Assessment Total Assessment is a certain percentage of the fair market value that is determined by local assessors to be the total taxable value of land and additions on the property. | Land | Improvement |
|---|---|---|---|---|
| 2024 | $5,295 | $61,445 | $25,980 | $35,465 |
| 2023 | $4,829 | $56,673 | $23,962 | $32,711 |
| 2022 | $4,829 | $51,728 | $23,033 | $28,695 |
| 2021 | $4,626 | $50,614 | $22,537 | $28,077 |
| 2020 | $4,462 | $49,763 | $22,158 | $27,605 |
| 2019 | $3,826 | $49,290 | $21,947 | $27,343 |
| 2018 | $3,368 | $44,888 | $21,857 | $23,031 |
| 2017 | $3,310 | $43,471 | $21,167 | $22,304 |
| 2016 | $3,156 | $41,216 | $20,069 | $21,147 |
| 2015 | $3,083 | $38,523 | $18,758 | $19,765 |
| 2014 | $3,153 | $37,629 | $18,506 | $19,123 |
| 2012 | $3,435 | $38,760 | $18,667 | $20,093 |
Source: Public Records
Map
Nearby Homes
- 365 Jefferson Ct Unit 65
- 464 Buchanan Ct
- 1028 Cumberland Ct
- 139 Windsor Dr Unit 123
- 717 Summit Ln
- 1049 Kingston Ct
- 15 Crestview Ln Unit 4
- 1109 Grant Place
- 608 Sycamore St
- 4 Parkside Ct Unit 12
- 1434 Maidstone Dr
- 900 S Butterfield Rd
- 668 Portage Ct Unit 345
- 580 Muskegan Ct Unit 401
- 307 Albright Ct
- 227 Augusta Dr
- 1303 Orleans Dr Unit 1303
- 1220 Orleans Dr Unit 1220
- 602 Muskegan Ct Unit 387
- 872 Lansing Ct Unit 151
- 932 Adams Ct Unit 94
- 928 Adams Ct
- 934 Adams Ct Unit 95
- 926 Adams Ct Unit 91
- 936 Adams Ct Unit 96
- 936 Adams Ct Unit 936
- 925 Adams Ct Unit 49
- 927 Adams Ct Unit 50
- 929 Adams Ct Unit 51
- 931 Adams Ct Unit 52
- 931 Adams Ct Unit 3
- 933 Adams Ct Unit 53
- 382 Washington Ct Unit 87
- 935 Adams Ct
- 384 Washington Ct Unit 86
- 378 Washington Ct Unit 89
- 380 Washington Ct
- 386 Washington Ct Unit 85
- 901 Jackson Ct
- 903 Jackson Ct Unit 98