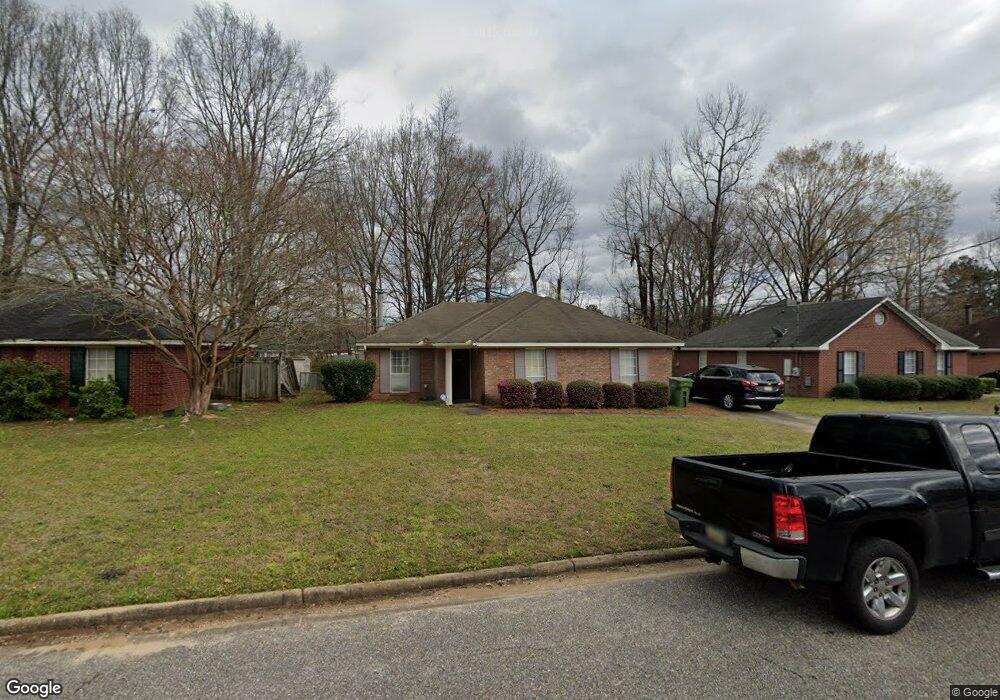
930 Brookland Curve Montgomery, AL 36117
East Montgomery NeighborhoodEstimated Value: $183,000 - $191,000
3
Beds
2
Baths
1,338
Sq Ft
$139/Sq Ft
Est. Value
About This Home
This home is located at 930 Brookland Curve, Montgomery, AL 36117 and is currently estimated at $185,963, approximately $138 per square foot. 930 Brookland Curve is a home located in Montgomery County with nearby schools including William Silas Garrett Elementary School, Goodwyn Middle School, and Dr. Percy L. Julian High School.
Ownership History
Date
Name
Owned For
Owner Type
Purchase Details
Closed on
Dec 27, 2010
Sold by
Knockemus Shane P
Bought by
Vaughn Tonia M
Current Estimated Value
Home Financials for this Owner
Home Financials are based on the most recent Mortgage that was taken out on this home.
Original Mortgage
$104,774
Outstanding Balance
$70,202
Interest Rate
4.5%
Mortgage Type
FHA
Estimated Equity
$115,761
Purchase Details
Closed on
Jun 15, 2004
Sold by
Knockemus Shane P and Knockemus Peggy
Bought by
Knockemus Shane P
Home Financials for this Owner
Home Financials are based on the most recent Mortgage that was taken out on this home.
Original Mortgage
$35,000
Interest Rate
6.25%
Mortgage Type
Stand Alone Second
Create a Home Valuation Report for This Property
The Home Valuation Report is an in-depth analysis detailing your home's value as well as a comparison with similar homes in the area
Home Values in the Area
Average Home Value in this Area
Purchase History
| Date | Buyer | Sale Price | Title Company |
|---|---|---|---|
| Vaughn Tonia M | $72,100 | None Available | |
| Knockemus Shane P | $35,500 | -- |
Source: Public Records
Mortgage History
| Date | Status | Borrower | Loan Amount |
|---|---|---|---|
| Open | Vaughn Tonia M | $104,774 | |
| Closed | Vaughn Tonia M | $104,774 | |
| Closed | Vaughn Tonia M | $3,225 | |
| Previous Owner | Knockemus Shane P | $35,000 |
Source: Public Records
Tax History Compared to Growth
Tax History
| Year | Tax Paid | Tax Assessment Tax Assessment Total Assessment is a certain percentage of the fair market value that is determined by local assessors to be the total taxable value of land and additions on the property. | Land | Improvement |
|---|---|---|---|---|
| 2025 | $728 | $15,630 | $2,500 | $13,130 |
| 2024 | $710 | $15,270 | $2,500 | $12,770 |
| 2023 | $710 | $14,070 | $2,500 | $11,570 |
| 2022 | $386 | $11,690 | $2,500 | $9,190 |
| 2021 | $339 | $10,400 | $0 | $0 |
| 2020 | $339 | $10,390 | $2,500 | $7,890 |
| 2019 | $338 | $10,380 | $2,500 | $7,880 |
| 2018 | $382 | $10,450 | $2,500 | $7,950 |
| 2017 | $324 | $19,980 | $5,000 | $14,980 |
| 2014 | $339 | $10,390 | $2,500 | $7,890 |
| 2013 | -- | $11,060 | $2,500 | $8,560 |
Source: Public Records
Map
Nearby Homes
- 925 Brookland Curve
- 6429 Sandy Ridge Curve
- 6104 Bald Cypress Ct
- 6500 Sweet Gum Dr
- 5728 Sweet Meadow Dr
- 1308 Pondcypress Dr
- 1308 Dunbarton Rd
- 970 Countryside Ln
- 5701 Bangor Ct
- 5805 Acacia Ct
- 5821 Hyde Park Dr
- 709 Balfour Rd
- 749 Amity Ln
- 767 N Burbank Dr
- 6201 Dalford Dr
- 6241 Wares Ferry Rd
- 740 Havelock Ln
- 5737 Darien Dr
- 6520 Pinebrook Dr
- 6901 Eastern Shore Rd
- 924 Brookland Curve
- 944 Brookland Curve
- 918 Brookland Curve
- 6276 Sycamore Dr
- 6280 Sycamore Dr
- 6272 Sycamore Dr
- 909 Daisy Ct
- 912 Brookland Curve
- 905 Daisy Ct
- 6284 Sycamore Dr
- 6268 Sycamore Dr
- 931 Brookland Curve
- 937 Brookland Curve
- 906 Brookland Curve
- 919 Brookland Curve
- 6288 Sycamore Dr
- 943 Brookland Curve
- 913 Brookland Curve
- 900 Daisy Ct
- 907 Brookland Curve