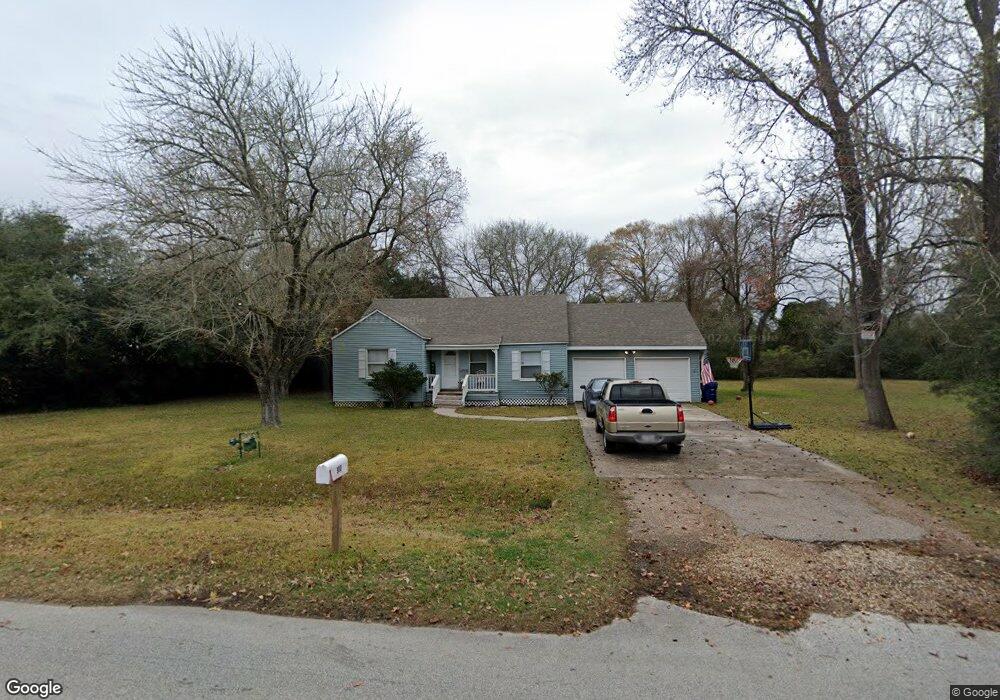
930 Carrell St Tomball, TX 77375
Estimated Value: $219,894 - $284,000
3
Beds
2
Baths
1,362
Sq Ft
$191/Sq Ft
Est. Value
About This Home
This home is located at 930 Carrell St, Tomball, TX 77375 and is currently estimated at $260,224, approximately $191 per square foot. 930 Carrell St is a home located in Harris County with nearby schools including Tomball Elementary School, Tomball Intermediate School, and Tomball Junior High School.
Ownership History
Date
Name
Owned For
Owner Type
Purchase Details
Closed on
Feb 18, 2025
Sold by
Holmes Janet C and Holmes John Scott
Bought by
3434 Holdings Llc
Current Estimated Value
Purchase Details
Closed on
Aug 16, 2001
Sold by
Boyd Katie L
Bought by
Holmes J Scott and Holmes Janet
Home Financials for this Owner
Home Financials are based on the most recent Mortgage that was taken out on this home.
Original Mortgage
$83,700
Interest Rate
7.14%
Purchase Details
Closed on
May 4, 1999
Sold by
Maalouf Joseph Michael
Bought by
Walton Steven Lindberg and Walton Karen Marie W
Home Financials for this Owner
Home Financials are based on the most recent Mortgage that was taken out on this home.
Original Mortgage
$100,000
Interest Rate
6.99%
Create a Home Valuation Report for This Property
The Home Valuation Report is an in-depth analysis detailing your home's value as well as a comparison with similar homes in the area
Home Values in the Area
Average Home Value in this Area
Purchase History
| Date | Buyer | Sale Price | Title Company |
|---|---|---|---|
| 3434 Holdings Llc | -- | None Listed On Document | |
| Holmes J Scott | -- | Chicago Title | |
| Walton Steven Lindberg | -- | First American Title |
Source: Public Records
Mortgage History
| Date | Status | Borrower | Loan Amount |
|---|---|---|---|
| Previous Owner | Holmes J Scott | $83,700 | |
| Previous Owner | Walton Steven Lindberg | $100,000 |
Source: Public Records
Tax History Compared to Growth
Tax History
| Year | Tax Paid | Tax Assessment Tax Assessment Total Assessment is a certain percentage of the fair market value that is determined by local assessors to be the total taxable value of land and additions on the property. | Land | Improvement |
|---|---|---|---|---|
| 2025 | $3,302 | $155,393 | $44,823 | $110,570 |
| 2024 | $3,302 | $149,209 | $44,823 | $104,386 |
| 2023 | $3,302 | $159,286 | $44,823 | $114,463 |
| 2022 | $2,789 | $123,733 | $44,823 | $78,910 |
| 2021 | $2,282 | $96,236 | $44,823 | $51,413 |
| 2020 | $2,328 | $94,904 | $44,823 | $50,081 |
| 2019 | $2,192 | $86,893 | $44,823 | $42,070 |
| 2018 | $1,164 | $86,893 | $44,823 | $42,070 |
| 2017 | $2,190 | $86,893 | $44,823 | $42,070 |
| 2016 | $2,190 | $86,893 | $44,823 | $42,070 |
| 2015 | $2,337 | $86,893 | $44,823 | $42,070 |
| 2014 | $2,337 | $91,811 | $44,823 | $46,988 |
Source: Public Records
Map
Nearby Homes
- 1011 Cedar Post Ct
- 1107 Grand Junction Dr
- 1154 Magnolia Branch Ln
- 1166 Magnolia Branch Ln
- 1110 Bending Trail Dr
- 803 Junction Point Ln
- 1114 Buffalo Run
- 910 Lovett Ct
- 919 Lovett Ct
- 1059 Bending Trail Dr
- 1103 Hidden Oaks Dr
- 1323 E Hufsmith Rd
- 23602 Olive Gully Ln
- 532 Carrell St
- 24102 Flax Ct
- 1214 Hidden Oaks Dr
- 23626 Golden Birch Bend
- 1231 Hidden Oaks Dr
- 9214 Trimble Landing Dr
- 1306 Hidden Oaks Dr
- 923 Carrell St Unit C
- 923 Carrell St Unit B
- 927 Carrell St Unit 4
- 927 Carrell St Unit D
- 919 Carrell St Unit D
- 12403 Washington Way
- 12427 Washington Way
- 12419 Washington Way
- 931 Carrell St Unit A
- 922 Bolton Ct
- 926 Bolton Ct
- 0 Lovett St
- 1219 Lovett St
- 1037 Lovett St
- 1055 Lovett St
- 1047 Lovett St
- 1059 Lovett St
- 1057 Lovett St
- 1035 Lovett St
- 1039 Lovett St