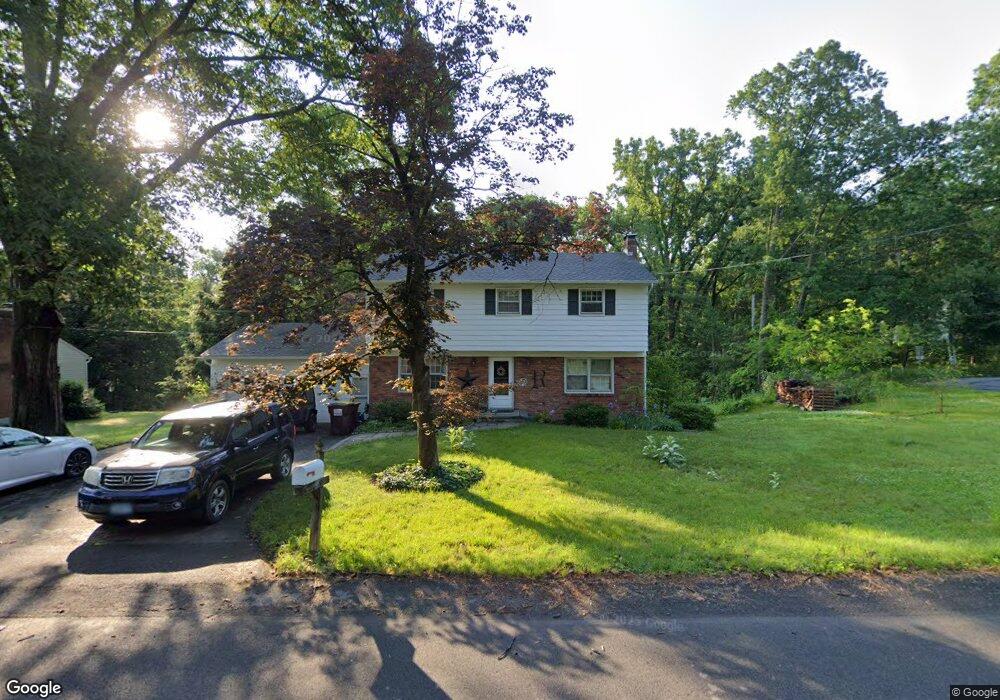
930 Catalpa Ct Schenectady, NY 12309
Estimated Value: $418,000 - $446,912
4
Beds
5
Baths
2,000
Sq Ft
$217/Sq Ft
Est. Value
About This Home
This home is located at 930 Catalpa Ct, Schenectady, NY 12309 and is currently estimated at $434,478, approximately $217 per square foot. 930 Catalpa Ct is a home located in Schenectady County with nearby schools including Birchwood Elementary School, Iroquois Middle School, and Van Antwerp Middle School.
Ownership History
Date
Name
Owned For
Owner Type
Purchase Details
Closed on
Apr 7, 2011
Sold by
Romanchuk Aimee and Domenici Aimee
Bought by
Rutland Richard Paul and Diaz Tara Leigh
Current Estimated Value
Home Financials for this Owner
Home Financials are based on the most recent Mortgage that was taken out on this home.
Original Mortgage
$266,000
Outstanding Balance
$181,845
Interest Rate
4.76%
Mortgage Type
New Conventional
Estimated Equity
$252,633
Purchase Details
Closed on
Jun 16, 2008
Sold by
Trustee Wagar Samuel Niron
Bought by
Romanchub Aimee
Home Financials for this Owner
Home Financials are based on the most recent Mortgage that was taken out on this home.
Original Mortgage
$177,600
Interest Rate
6.07%
Mortgage Type
New Conventional
Purchase Details
Closed on
Oct 10, 1996
Purchase Details
Closed on
Oct 11, 1995
Sold by
Male Inc Charles T
Bought by
Wagar John E
Create a Home Valuation Report for This Property
The Home Valuation Report is an in-depth analysis detailing your home's value as well as a comparison with similar homes in the area
Home Values in the Area
Average Home Value in this Area
Purchase History
| Date | Buyer | Sale Price | Title Company |
|---|---|---|---|
| Rutland Richard Paul | $280,000 | None Available | |
| Romanchub Aimee | $222,000 | Theresa Ries | |
| -- | -- | -- | |
| Wagar John E | $7,500 | -- |
Source: Public Records
Mortgage History
| Date | Status | Borrower | Loan Amount |
|---|---|---|---|
| Open | Rutland Richard Paul | $266,000 | |
| Previous Owner | Romanchub Aimee | $177,600 |
Source: Public Records
Tax History
| Year | Tax Paid | Tax Assessment Tax Assessment Total Assessment is a certain percentage of the fair market value that is determined by local assessors to be the total taxable value of land and additions on the property. | Land | Improvement |
|---|---|---|---|---|
| 2024 | $11,469 | $264,000 | $52,000 | $212,000 |
| 2023 | $116 | $264,000 | $52,000 | $212,000 |
| 2022 | $11,245 | $264,000 | $52,000 | $212,000 |
| 2021 | $8,875 | $264,000 | $52,000 | $212,000 |
| 2020 | $7,967 | $264,000 | $52,000 | $212,000 |
| 2019 | $4,576 | $264,000 | $52,000 | $212,000 |
| 2018 | $8,068 | $264,000 | $52,000 | $212,000 |
| 2017 | $7,702 | $264,000 | $52,000 | $212,000 |
| 2016 | $7,962 | $264,000 | $52,000 | $212,000 |
| 2015 | -- | $264,000 | $52,000 | $212,000 |
| 2014 | -- | $264,000 | $52,000 | $212,000 |
Source: Public Records
Map
Nearby Homes
- 4 Oaktree Ln
- 2965 Hillcrest Rd
- 73 Ashtree Ln
- 607 Vly Pointe Dr
- 605 Vly Pointe Dr
- 388 Vly Rd
- 331 Vly Rd
- 2808 Troy Schenectady Rd
- 227 Shaker Ridge Dr
- 76 Tamarack Ln
- 31 Amelia Dr
- 4 Dahlem Blvd
- 145 Killarney Dr
- 871 Maxwell Dr
- 18 Dublin Dr
- 66 Shinnecock Hills Dr
- 65 Dublin Dr
- 5 Emmett Dr
- 2510 Troy-Schenectady Rd
- 647 Pearse Rd
- 934 Catalpa Ct
- 00 Tulip Tree La
- 0 Tulip Tree Ln
- 937 Ash Tree Ln
- 942 Ash Tree Ln
- 938 Ashtree Ln
- 938 Catalpa Ct
- 2 Tulip Tree Ln
- 938 Ash Tree Ln
- 935 Catalpa Ct
- 933 Ash Tree Ln
- 933 Ashtree Ln
- 942 Catalpa Ct
- 904 Riverview Rd
- 939 Catalpa Ct
- 4 Tulip Tree La
- 16 Oaktree Ln
- 16 Oak Tree Ln
- 4 Tulip Tree Ln
- 14 Oaktree Ln
Your Personal Tour Guide
Ask me questions while you tour the home.