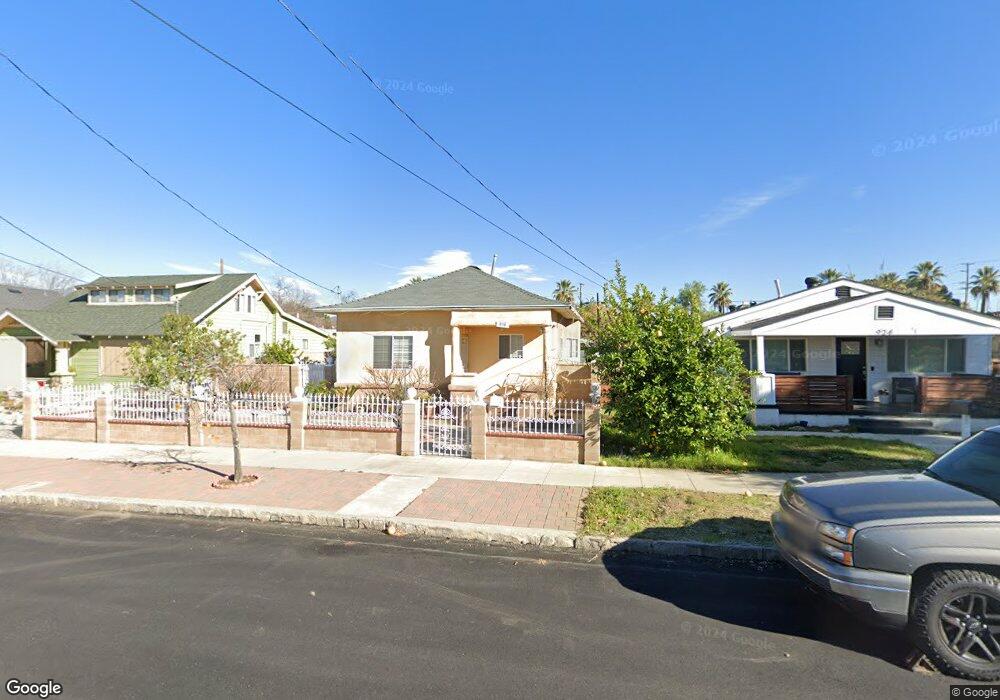
930 Clay St Redlands, CA 92374
North Redlands NeighborhoodEstimated Value: $430,756 - $489,000
About This Home
This home is located at 930 Clay St, Redlands, CA 92374 and is currently estimated at $460,189, approximately $422 per square foot. 930 Clay St is a home located in San Bernardino County with nearby schools including Kimberly Elementary School, Moore Middle School, and Redlands East Valley High School.
Ownership History
We collect this data history from publicly available records. To have your information removed, we recommend requesting removal directly through your county’s website.
Purchase Details
Purchase Details
Purchase Details
Purchase Details
Home Values in the Area
Average Home Value in this Area
Purchase History
We collect this data history from publicly available records. To have your information removed, we recommend requesting removal directly through your county’s website.
| Date | Buyer | Sale Price | Title Company |
|---|---|---|---|
| -- | None Listed On Document | ||
| -- | None Available | ||
| -- | Orange Coast Title Company | ||
| -- | -- |
Tax History
We collect this data history from publicly available records. To have your information removed, we recommend requesting removal directly through your county’s website.
| Year | Tax Paid | Tax Assessment Tax Assessment Total Assessment is a certain percentage of the fair market value that is determined by local assessors to be the total taxable value of land and additions on the property. | Land | Improvement |
|---|---|---|---|---|
| 2026 | $1,517 | $121,626 | $42,727 | $78,899 |
| 2025 | $1,517 | $119,241 | $41,889 | $77,352 |
| 2024 | $1,436 | $118,347 | $41,576 | $76,771 |
| 2023 | $1,434 | $116,027 | $40,761 | $75,266 |
| 2022 | $1,414 | $113,752 | $39,962 | $73,790 |
| 2021 | $1,439 | $111,521 | $39,178 | $72,343 |
| 2020 | $1,418 | $110,377 | $38,776 | $71,601 |
| 2019 | $1,379 | $108,213 | $38,016 | $70,197 |
| 2018 | $1,346 | $106,092 | $37,271 | $68,821 |
| 2017 | $1,335 | $104,012 | $36,540 | $67,472 |
| 2016 | $1,320 | $101,973 | $35,824 | $66,149 |
| 2015 | $1,311 | $100,441 | $35,286 | $65,155 |
| 2014 | $1,288 | $98,474 | $34,595 | $63,879 |
Map
- 1005 Ohio St
- 1105 Orange St
- 1107 Orange St
- 1143 Orange St
- 601 Ruiz St
- 527 Ruiz St
- 1220 Webster St
- 1132 Calhoun St
- 210 E High Ave
- 215 W Lugonia Ave
- 316 W Lugonia Ave Unit 320
- 0 0 Unit IG26066829
- 1140 Oxford Dr
- 838 W Brockton Ave
- 1103 Church St
- 1450 Washington St
- 610 E Lugonia Ave Unit 4
- 831 W Lugonia Ave
- 1421 De Anza St
- 521 W Citrus Ave
- 917 Washington St
- 911 Washington St
- 923 Washington St
- 907 Washington St
- 927 Washington St
- 901 Washington St
- 920 Clay St
- 929 Washington St
- 914 Clay St
- 924 Clay St
- 908 Clay St
- 922 Washington St
- 910 Washington St
- 904 Clay St
- 937 Washington St
- 908 Washington St
- 936 Clay St
- 902 Washington St
- 926 Washington St
- 940 Clay St
Ask me questions while you tour the home.