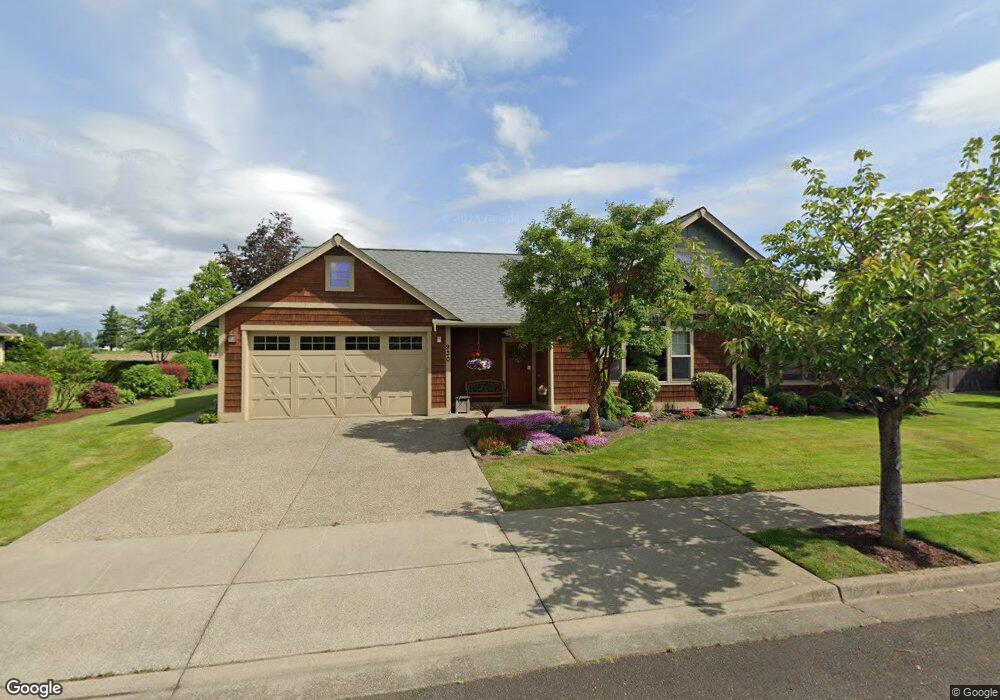
930 Hemlock Loop Lynden, WA 98264
Estimated Value: $640,437 - $695,000
2
Beds
2
Baths
1,834
Sq Ft
$364/Sq Ft
Est. Value
About This Home
This home is located at 930 Hemlock Loop, Lynden, WA 98264 and is currently estimated at $668,109, approximately $364 per square foot. 930 Hemlock Loop is a home located in Whatcom County with nearby schools including Lynden High School, Lynden Christian School, and Lynden Christian Schools: Administration.
Ownership History
Date
Name
Owned For
Owner Type
Purchase Details
Closed on
Feb 10, 2026
Sold by
Massanari R Michael R and Massanari Lois J
Bought by
Tandecki Living Trust and Tandecki
Current Estimated Value
Home Financials for this Owner
Home Financials are based on the most recent Mortgage that was taken out on this home.
Original Mortgage
$450,000
Outstanding Balance
$450,000
Interest Rate
6.15%
Mortgage Type
New Conventional
Estimated Equity
$218,109
Purchase Details
Closed on
Mar 1, 2011
Sold by
Massanari Lois J
Bought by
Massanari R Michael and Massanari Lois J
Purchase Details
Closed on
Jun 27, 2006
Sold by
Williamson Daniel G and Williamson Teresa
Bought by
Massanari Lois J
Create a Home Valuation Report for This Property
The Home Valuation Report is an in-depth analysis detailing your home's value as well as a comparison with similar homes in the area
Home Values in the Area
Average Home Value in this Area
Purchase History
| Date | Buyer | Sale Price | Title Company |
|---|---|---|---|
| Tandecki Living Trust | $645,000 | Chicago Title | |
| Massanari R Michael | -- | None Available | |
| Massanari Lois J | -- | None Available | |
| Massanari Lois J | $346,680 | First American Title Insuran |
Source: Public Records
Mortgage History
| Date | Status | Borrower | Loan Amount |
|---|---|---|---|
| Open | Tandecki Living Trust | $450,000 |
Source: Public Records
Tax History
| Year | Tax Paid | Tax Assessment Tax Assessment Total Assessment is a certain percentage of the fair market value that is determined by local assessors to be the total taxable value of land and additions on the property. | Land | Improvement |
|---|---|---|---|---|
| 2025 | $4,710 | $640,665 | $272,825 | $367,840 |
| 2024 | $4,414 | $621,716 | $242,500 | $379,216 |
| 2023 | $4,414 | $614,631 | $250,000 | $364,631 |
| 2022 | $3,997 | $525,023 | $127,711 | $397,312 |
| 2021 | $3,920 | $433,898 | $105,545 | $328,353 |
| 2020 | $3,434 | $387,419 | $94,239 | $293,180 |
| 2019 | $3,055 | $355,275 | $86,527 | $268,748 |
| 2018 | $3,339 | $324,042 | $78,823 | $245,219 |
| 2017 | $3,087 | $290,855 | $70,750 | $220,105 |
| 2016 | $2,906 | $286,032 | $66,000 | $220,032 |
| 2015 | $2,576 | $267,817 | $63,480 | $204,337 |
| 2014 | -- | $258,747 | $61,320 | $197,427 |
| 2013 | -- | $257,427 | $60,000 | $197,427 |
Source: Public Records
Map
Nearby Homes
- 8424 Double Ditch Rd
- 902 Captain Bay Ct
- 816 Cedar Dr
- 805 Cedar Dr
- 1656 Liberty St Unit 101
- 735 Ivy St
- 801 19th St
- 108 Fairside Dr Unit 1
- 410 10th St
- 1884 Front St Unit B
- 1884 Front St
- 1884 Front St Unit A
- 1739 Emerald Way
- 0 Guide Meridian Unit NWM2369980
- 919 Liberty St
- 761 Sunrise Dr
- 1416 Front St
- 1882 Front St Unit B302
- 903 Diamond Ln
- 1510 E St
- 936 Hemlock Loop
- 924 Hemlock Loop
- 925 Hemlock Loop
- 913 Hemlock Loop
- 918 Hemlock Loop
- 942 Hemlock Loop
- 937 Hemlock Loop
- 912 Hemlock Loop
- 959 Hemlock Loop
- 906 Hemlock Loop
- 1744 Pine St
- 901 Hemlock Loop
- 948 Hemlock Loop
- 954 Hemlock Loop
- 941 Barley Ct
- 953 Barley Ct
- 971 Hemlock Loop
- 960 Hemlock Loop
- 929 Barley Ct
- 900 Hemlock Loop
Your Personal Tour Guide
Ask me questions while you tour the home.