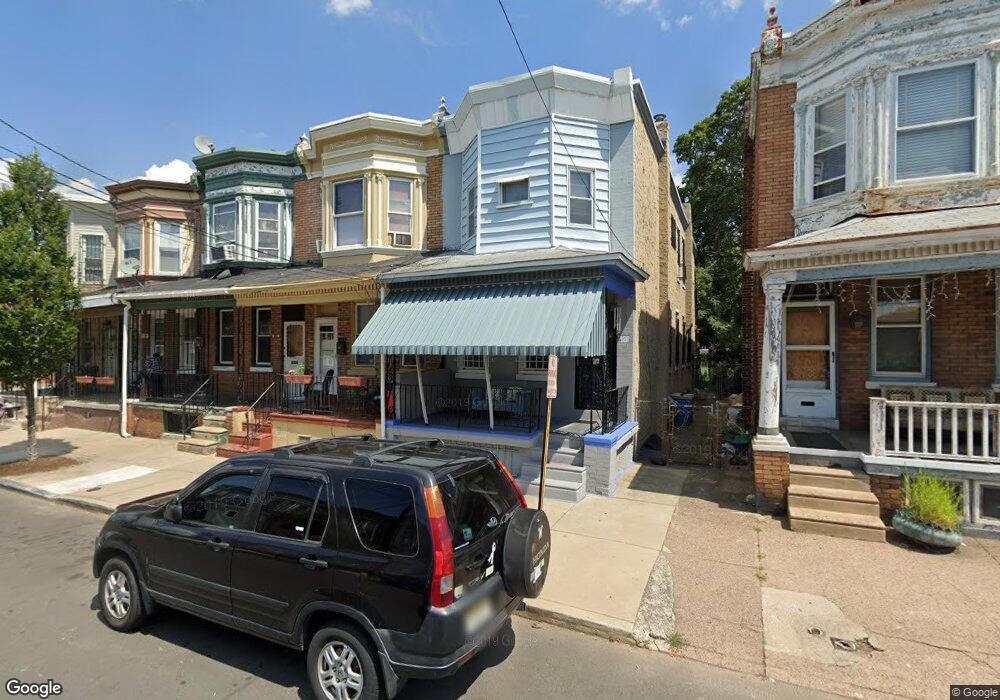
930 N 4th St Camden, NJ 08102
North Camden NeighborhoodEstimated Value: $124,986 - $171,000
3
Beds
1
Bath
1,293
Sq Ft
$120/Sq Ft
Est. Value
About This Home
This home is located at 930 N 4th St, Camden, NJ 08102 and is currently estimated at $155,247, approximately $120 per square foot. 930 N 4th St is a home located in Camden County with nearby schools including Cooper's Poynt Elementary School, Eastside High School, and Leap Academy University Charter School.
Ownership History
Date
Name
Owned For
Owner Type
Purchase Details
Closed on
Sep 17, 2025
Sold by
Garcia Castelan Margarita
Bought by
Bello Jose Anthony
Current Estimated Value
Purchase Details
Closed on
Aug 15, 2016
Sold by
Cosme Fred
Bought by
Castelan Margarita Garici
Purchase Details
Closed on
Jul 5, 2015
Sold by
Theisen Lisbeth A and Garcia Lois
Bought by
Cosme Fred
Purchase Details
Closed on
May 14, 2004
Sold by
Figueroa Antonio
Bought by
Theisen Lisbeth A and Garcis Louis
Purchase Details
Closed on
Dec 4, 2003
Sold by
Caulborne Craig D
Bought by
Figueroa Antonio
Create a Home Valuation Report for This Property
The Home Valuation Report is an in-depth analysis detailing your home's value as well as a comparison with similar homes in the area
Home Values in the Area
Average Home Value in this Area
Purchase History
| Date | Buyer | Sale Price | Title Company |
|---|---|---|---|
| Bello Jose Anthony | -- | None Listed On Document | |
| Bello Jose Anthony | -- | None Listed On Document | |
| Castelan Margarita Garici | -- | None Available | |
| Cosme Fred | $29,500 | Attorney | |
| Theisen Lisbeth A | $37,000 | -- | |
| Figueroa Antonio | $17,000 | -- |
Source: Public Records
Tax History Compared to Growth
Tax History
| Year | Tax Paid | Tax Assessment Tax Assessment Total Assessment is a certain percentage of the fair market value that is determined by local assessors to be the total taxable value of land and additions on the property. | Land | Improvement |
|---|---|---|---|---|
| 2025 | $1,619 | $45,700 | $6,000 | $39,700 |
| 2024 | $1,565 | $45,700 | $6,000 | $39,700 |
| 2023 | $1,565 | $45,700 | $6,000 | $39,700 |
| 2022 | $1,536 | $45,700 | $6,000 | $39,700 |
| 2021 | $1,530 | $45,700 | $6,000 | $39,700 |
| 2020 | $1,453 | $45,700 | $6,000 | $39,700 |
| 2019 | $1,392 | $45,700 | $6,000 | $39,700 |
| 2018 | $1,384 | $45,700 | $6,000 | $39,700 |
| 2017 | $1,350 | $45,700 | $6,000 | $39,700 |
| 2016 | $1,307 | $45,700 | $6,000 | $39,700 |
| 2015 | $1,259 | $45,700 | $6,000 | $39,700 |
| 2014 | $1,228 | $45,700 | $6,000 | $39,700 |
Source: Public Records
Map
Nearby Homes