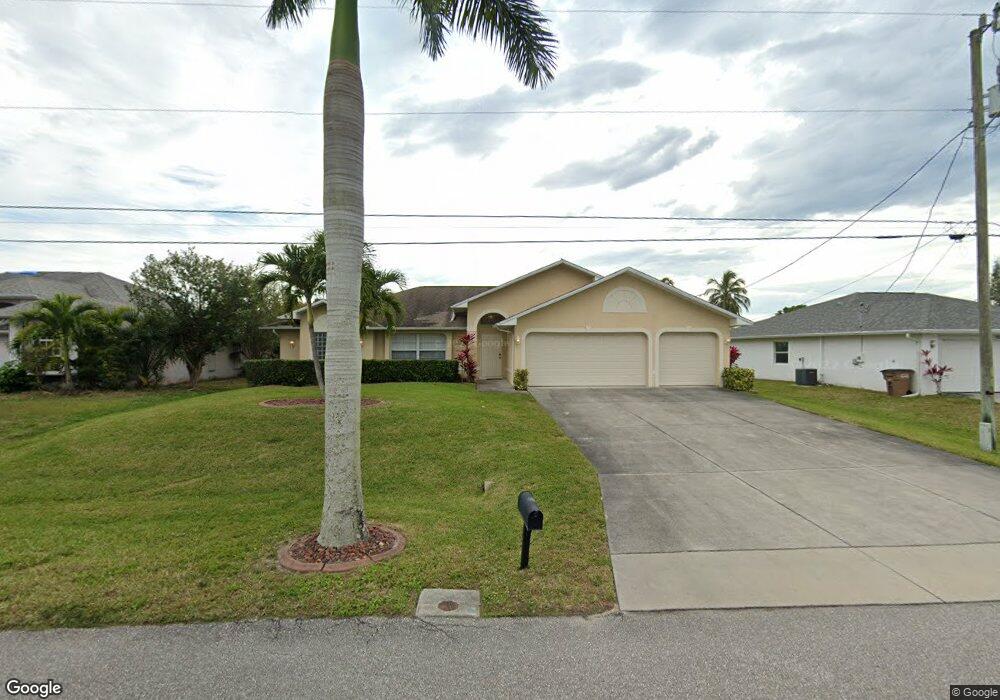
930 SW 15th St Cape Coral, FL 33991
Trafalgar NeighborhoodEstimated Value: $414,395 - $480,000
3
Beds
2
Baths
2,081
Sq Ft
$208/Sq Ft
Est. Value
About This Home
This home is located at 930 SW 15th St, Cape Coral, FL 33991 and is currently estimated at $432,099, approximately $207 per square foot. 930 SW 15th St is a home located in Lee County with nearby schools including Caloosa Elementary School, Tropic Isles Elementary School, and Cape Elementary School.
Ownership History
Date
Name
Owned For
Owner Type
Purchase Details
Closed on
Dec 30, 2009
Sold by
Bauriedl Birgit
Bought by
Realtec Inc
Current Estimated Value
Purchase Details
Closed on
Dec 3, 2009
Sold by
Federal Home Loan Mortgage Corporation
Bought by
Bauriedl Birgit
Purchase Details
Closed on
Oct 19, 2009
Sold by
Aurora Loan Services Ll
Bought by
Federal Home Loan Mortgage Corp
Purchase Details
Closed on
Oct 14, 2009
Sold by
Chambers Scott E and Chambers Kimberly S
Bought by
Aurora Loan Services Llc
Purchase Details
Closed on
Nov 17, 2004
Sold by
Graham Octavius S and Graham Valerie J
Bought by
Chambers Scott E and Chambers Kimberly A
Home Financials for this Owner
Home Financials are based on the most recent Mortgage that was taken out on this home.
Original Mortgage
$280,705
Interest Rate
5.6%
Mortgage Type
Unknown
Create a Home Valuation Report for This Property
The Home Valuation Report is an in-depth analysis detailing your home's value as well as a comparison with similar homes in the area
Home Values in the Area
Average Home Value in this Area
Purchase History
| Date | Buyer | Sale Price | Title Company |
|---|---|---|---|
| Realtec Inc | -- | None Available | |
| Bauriedl Birgit | $156,000 | New House Title Llc | |
| Federal Home Loan Mortgage Corp | -- | Attorney | |
| Aurora Loan Services Llc | -- | Attorney | |
| Chambers Scott E | $71,900 | Lawyers Title Ins |
Source: Public Records
Mortgage History
| Date | Status | Borrower | Loan Amount |
|---|---|---|---|
| Previous Owner | Chambers Scott E | $280,705 |
Source: Public Records
Tax History Compared to Growth
Tax History
| Year | Tax Paid | Tax Assessment Tax Assessment Total Assessment is a certain percentage of the fair market value that is determined by local assessors to be the total taxable value of land and additions on the property. | Land | Improvement |
|---|---|---|---|---|
| 2025 | $6,433 | $347,855 | $58,140 | $266,899 |
| 2024 | $6,201 | $334,565 | -- | -- |
| 2023 | $6,201 | $304,150 | $0 | $0 |
| 2022 | $5,403 | $276,500 | $0 | $0 |
| 2021 | $4,962 | $251,946 | $26,000 | $225,946 |
| 2020 | $4,711 | $228,513 | $22,000 | $206,513 |
| 2019 | $4,608 | $224,489 | $22,000 | $202,489 |
| 2018 | $4,474 | $212,364 | $20,500 | $191,864 |
| 2017 | $4,431 | $205,912 | $13,000 | $192,912 |
| 2016 | $4,217 | $197,034 | $13,000 | $184,034 |
| 2015 | $3,914 | $174,811 | $10,500 | $164,311 |
| 2014 | $3,725 | $163,305 | $9,900 | $153,405 |
| 2013 | -- | $148,011 | $12,100 | $135,911 |
Source: Public Records
Map
Nearby Homes
- 1421 SW 9th Ct
- 1422 SW 15th St
- 918 SW 15th St
- 1013 SW 15th Terrace
- 1425 SW 11th Ct
- 1406 SW 13th St
- 613 SW 13th St
- 815 SW Trafalgar Pkwy
- 833 SW 16th Terrace
- 1117 Trafalgar Pkwy
- 918 Trafalgar Pkwy
- 1506 Skyline Blvd
- 1114 SW Trafalgar Pkwy
- 117 SW 17th St
- 25/101 SW 16th Terrace
- 910 SW 12th Terrace
- 1511 Skyline Blvd
- 910 Skyline Blvd
- 1307+1311 Skyline Blvd
- 1102 Skyline Blvd
- 926 SW 15th St
- 1002 SW 15th St
- 1425 SW 10th Place
- 1428 SW 10th Place
- 917 SW 15th Terrace
- 1007 SW 15th Terrace
- 913 SW 15th Terrace
- 1010 SW 15th St Unit 63
- 1426 SW 9th Ct
- 1421 SW 10th Place
- 1424 SW 10th Place
- 909 SW 15th Terrace
- 1427 SW 11th Ave
- 623 SW 15th Terrace
- 1427 SW 15th Terrace
- 1419 SW 15th Terrace
- 914 SW 15th St
- 1014 SW 15th St
- 1422 SW 9th Ct
- 1013 SW 15th Terrace Unit 32