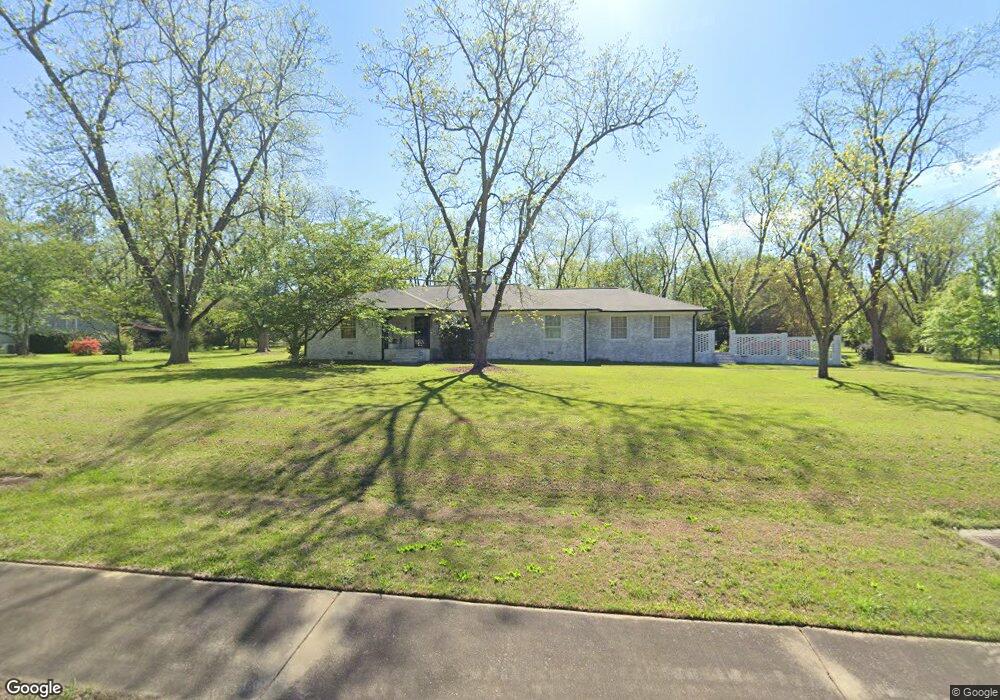
930 Thomaston St Barnesville, GA 30204
Estimated Value: $294,000 - $347,000
2
Beds
2
Baths
2,074
Sq Ft
$152/Sq Ft
Est. Value
About This Home
This home is located at 930 Thomaston St, Barnesville, GA 30204 and is currently estimated at $314,717, approximately $151 per square foot. 930 Thomaston St is a home located in Lamar County with nearby schools including Lamar County Primary School, Lamar County Elementary School, and Lamar County Middle School.
Ownership History
Date
Name
Owned For
Owner Type
Purchase Details
Closed on
Nov 10, 2016
Sold by
Hammond Barbara S
Bought by
Hames Rachel M and Hames Bryon G
Current Estimated Value
Home Financials for this Owner
Home Financials are based on the most recent Mortgage that was taken out on this home.
Original Mortgage
$135,353
Outstanding Balance
$108,254
Interest Rate
3.47%
Mortgage Type
New Conventional
Estimated Equity
$206,463
Purchase Details
Closed on
Dec 3, 2014
Sold by
Underwood Robyn
Bought by
Hammond Barbara C
Home Financials for this Owner
Home Financials are based on the most recent Mortgage that was taken out on this home.
Original Mortgage
$140,000
Interest Rate
4.09%
Mortgage Type
New Conventional
Purchase Details
Closed on
May 25, 2007
Sold by
Andrews Mattie Pearl
Bought by
Chute Robyn Underwood
Purchase Details
Closed on
Jul 1, 1987
Sold by
Andrews James
Bought by
Andrews Mattie Pearl
Create a Home Valuation Report for This Property
The Home Valuation Report is an in-depth analysis detailing your home's value as well as a comparison with similar homes in the area
Home Values in the Area
Average Home Value in this Area
Purchase History
| Date | Buyer | Sale Price | Title Company |
|---|---|---|---|
| Hames Rachel M | $135,000 | -- | |
| Hammond Barbara C | $150,000 | -- | |
| Chute Robyn Underwood | $185,000 | -- | |
| Andrews Mattie Pearl | -- | -- | |
| Andrews Mattie Pearl | -- | -- |
Source: Public Records
Mortgage History
| Date | Status | Borrower | Loan Amount |
|---|---|---|---|
| Open | Hames Rachel M | $135,353 | |
| Previous Owner | Hammond Barbara C | $140,000 |
Source: Public Records
Tax History Compared to Growth
Tax History
| Year | Tax Paid | Tax Assessment Tax Assessment Total Assessment is a certain percentage of the fair market value that is determined by local assessors to be the total taxable value of land and additions on the property. | Land | Improvement |
|---|---|---|---|---|
| 2025 | $2,847 | $120,161 | $9,620 | $110,541 |
| 2024 | $2,847 | $99,353 | $9,620 | $89,733 |
| 2023 | $2,945 | $95,394 | $9,620 | $85,774 |
| 2022 | $2,002 | $72,538 | $9,620 | $62,918 |
| 2021 | $1,776 | $59,059 | $9,620 | $49,439 |
| 2020 | $1,671 | $52,795 | $9,620 | $43,175 |
| 2019 | $1,675 | $52,795 | $9,620 | $43,175 |
| 2018 | $1,335 | $43,816 | $9,620 | $34,196 |
| 2017 | $1,328 | $43,816 | $9,620 | $34,196 |
| 2016 | $1,328 | $43,816 | $9,620 | $34,196 |
| 2015 | $1,327 | $43,816 | $9,620 | $34,196 |
| 2014 | $1,286 | $43,816 | $9,620 | $34,196 |
| 2013 | -- | $43,816 | $9,620 | $34,196 |
Source: Public Records
Map
Nearby Homes
- 0 Veterns Pkwy Unit 10515268
- 0 Highway 341 S Unit 181569
- 0 Highway 341 S Unit 10610486
- 00 Yatesville Rd Unit 1
- 0 Yatesville Rd Unit 24570293
- 0 Yatesville Rd Unit 10650403
- 500 Rose Ave
- 0 College Dr Unit 10632977
- 125 Byrd St
- 205 Georgia Ave
- 150 Georgia Ave
- 205 Pine St
- 531 Thomaston St
- 420 Zebulon St
- 308 Moye St
- 13 Brown St
- 0 U S 341
- 303 Carleeta St
- 0 Us Highway 41
- 245 Atlanta St
- 937 Thomaston St
- 934 Thomaston St
- 924 Thomaston St
- 939 Thomaston St
- 933 Thomaston St
- 929 Thomaston St
- 941 Thomaston St
- 931 Thomaston St
- 920 Thomaston St
- 927 Thomaston St
- 927 Thomaston St
- 143 Murphey Ave
- 916 Thomaston St
- 911 Thomaston St
- 775 789 Veterans Pkwy
- 165 Murphey Ave
- 369 Highway 36 W
- 368 Highway 36 W
- 183 Murphey Ave
- 372 Highway 36 W