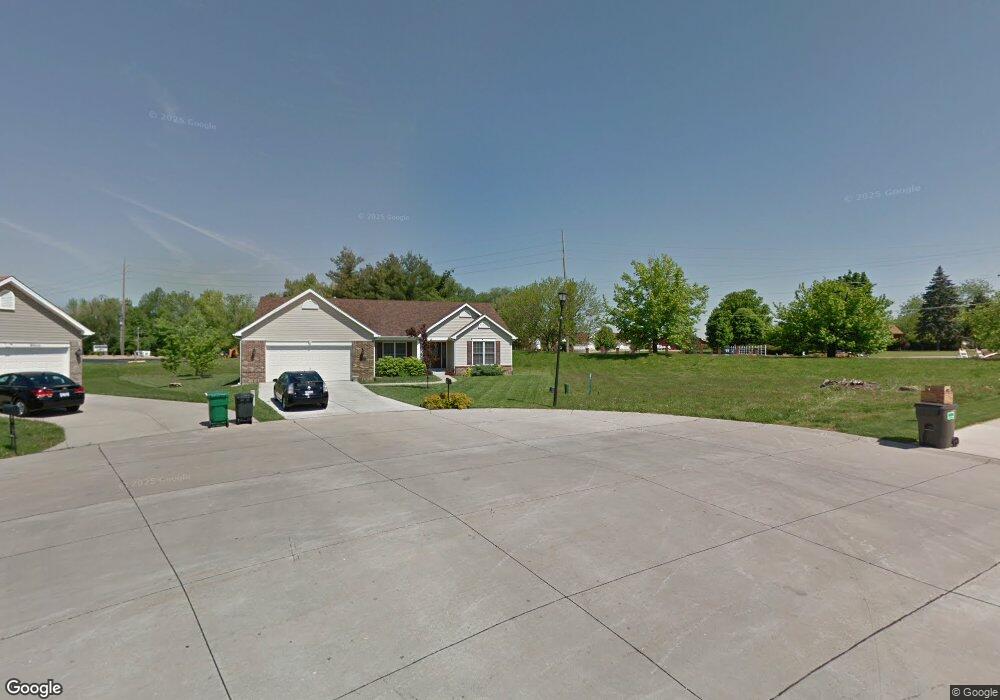
9300 Marbarry Dr Fairview Heights, IL 62208
Estimated Value: $315,000 - $346,000
--
Bed
--
Bath
2,100
Sq Ft
$156/Sq Ft
Est. Value
About This Home
This home is located at 9300 Marbarry Dr, Fairview Heights, IL 62208 and is currently estimated at $328,462, approximately $156 per square foot. 9300 Marbarry Dr is a home located in St. Clair County with nearby schools including Illini Elementary School, Grant Middle School, and Sister Thea Bowman Catholic School.
Ownership History
Date
Name
Owned For
Owner Type
Purchase Details
Closed on
Mar 12, 2019
Sold by
Mossey Troy L
Bought by
Mossey Michael J
Current Estimated Value
Purchase Details
Closed on
Mar 20, 2007
Sold by
T R Hughes Inc
Bought by
Mossey Michael J and Mossey Troy L
Home Financials for this Owner
Home Financials are based on the most recent Mortgage that was taken out on this home.
Original Mortgage
$183,658
Outstanding Balance
$111,226
Interest Rate
6.27%
Mortgage Type
Purchase Money Mortgage
Estimated Equity
$217,236
Create a Home Valuation Report for This Property
The Home Valuation Report is an in-depth analysis detailing your home's value as well as a comparison with similar homes in the area
Home Values in the Area
Average Home Value in this Area
Purchase History
| Date | Buyer | Sale Price | Title Company |
|---|---|---|---|
| Mossey Michael J | -- | Attorney | |
| Mossey Michael J | $230,000 | Benchmark Title Company |
Source: Public Records
Mortgage History
| Date | Status | Borrower | Loan Amount |
|---|---|---|---|
| Open | Mossey Michael J | $183,658 |
Source: Public Records
Tax History Compared to Growth
Tax History
| Year | Tax Paid | Tax Assessment Tax Assessment Total Assessment is a certain percentage of the fair market value that is determined by local assessors to be the total taxable value of land and additions on the property. | Land | Improvement |
|---|---|---|---|---|
| 2024 | $7,030 | $95,070 | $13,463 | $81,607 |
| 2023 | $6,625 | $84,118 | $11,912 | $72,206 |
| 2022 | $6,299 | $78,732 | $11,676 | $67,056 |
| 2021 | $6,511 | $74,727 | $11,082 | $63,645 |
| 2020 | $5,880 | $70,785 | $10,497 | $60,288 |
| 2019 | $5,663 | $70,785 | $10,497 | $60,288 |
| 2018 | $5,448 | $68,330 | $11,224 | $57,106 |
| 2017 | $5,313 | $65,557 | $10,768 | $54,789 |
| 2016 | $5,345 | $64,077 | $10,525 | $53,552 |
| 2014 | $4,750 | $64,658 | $12,028 | $52,630 |
| 2013 | $5,948 | $65,850 | $12,250 | $53,600 |
Source: Public Records
Map
Nearby Homes
- 120 Bunkum Woods Dr
- 116 Bunkum Woods Dr
- 200 Bunkum Woods Dr
- 204 Bunkum Woods Dr
- 208 Bunkum Woods Dr
- 212 Bunkum Woods Dr
- 300 Bunkum Woods Dr
- 103 Acres Bunkum Rd
- 115 Bunkum Woods Dr
- 9162 Basswood Dr
- 205 Bunkum Woods Dr
- 9158 Basswood Dr
- 9109 Birchwood Ct
- 9150 Basswood Dr
- 9110 Birchwood Ct
- 9114 Birchwood Ct
- 209 Bunkum Woods Dr
- 9145 Basswood Dr
- 9146 Basswood Dr
- 113 Barkwood Dr
- 9304 Marbarry Dr
- 9301 Marbarry Dr
- 9305 Marbarry Dr
- 9209 Bunkum Rd
- 9312 Marbarry Dr
- 9309 Marbarry Dr
- 9313 Marbarry Dr
- 9211 Bunkum Rd
- 9201 Bunkum Rd
- 9316 Marbarry Dr
- 9203 Old Bunkum Rd
- 9317 Marbarry Dr
- 9304 Camfield Dr
- 9303 Old Bunkum Rd
- 9320 Marbarry Dr
- 3810 Highland Rd
- 9321 Marbarry Dr
- 9301 Bunkum Rd
- 9305 Old Bunkum Rd
- 9305Old Bunkum Rd