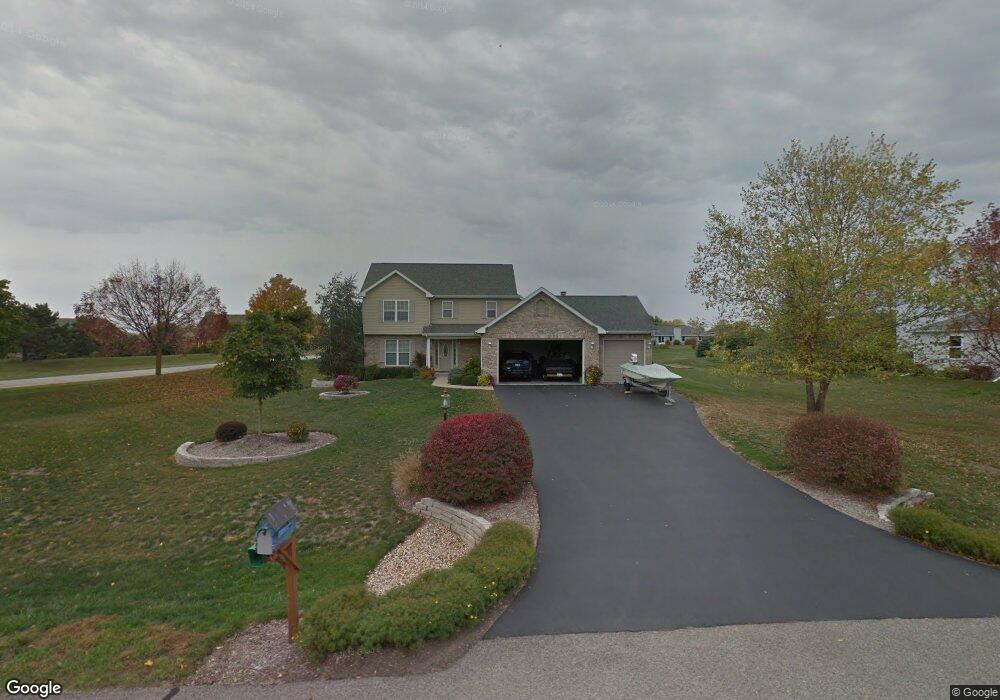
9301 Nicholas Ln Spring Grove, IL 60081
Estimated Value: $443,139 - $502,000
3
Beds
2
Baths
2,110
Sq Ft
$223/Sq Ft
Est. Value
About This Home
This home is located at 9301 Nicholas Ln, Spring Grove, IL 60081 and is currently estimated at $471,035, approximately $223 per square foot. 9301 Nicholas Ln is a home located in McHenry County with nearby schools including Richmond Grade School, Nippersink Middle School, and Richmond-Burton High School.
Ownership History
Date
Name
Owned For
Owner Type
Purchase Details
Closed on
Mar 19, 2004
Sold by
Primacy Closing Corp
Bought by
Evanger Ernest and Evanger Patricia
Current Estimated Value
Purchase Details
Closed on
Mar 1, 2004
Sold by
Osborne Thomas F and Osborne Isabel M
Bought by
Primary Closing Corp
Purchase Details
Closed on
Jun 29, 2001
Sold by
Celco Inc
Bought by
Osborne Thomas F and Osborne Isabel M
Home Financials for this Owner
Home Financials are based on the most recent Mortgage that was taken out on this home.
Original Mortgage
$197,300
Interest Rate
6.75%
Mortgage Type
Purchase Money Mortgage
Purchase Details
Closed on
Jun 21, 2001
Sold by
Celske Thomas A
Bought by
Celco Inc
Home Financials for this Owner
Home Financials are based on the most recent Mortgage that was taken out on this home.
Original Mortgage
$197,300
Interest Rate
6.75%
Mortgage Type
Purchase Money Mortgage
Create a Home Valuation Report for This Property
The Home Valuation Report is an in-depth analysis detailing your home's value as well as a comparison with similar homes in the area
Home Values in the Area
Average Home Value in this Area
Purchase History
| Date | Buyer | Sale Price | Title Company |
|---|---|---|---|
| Evanger Ernest | $285,000 | Fatic | |
| Primary Closing Corp | $285,000 | Fatic | |
| Osborne Thomas F | $247,000 | -- | |
| Celco Inc | -- | -- |
Source: Public Records
Mortgage History
| Date | Status | Borrower | Loan Amount |
|---|---|---|---|
| Previous Owner | Osborne Thomas F | $197,300 | |
| Closed | Osborne Thomas F | $25,000 |
Source: Public Records
Tax History Compared to Growth
Tax History
| Year | Tax Paid | Tax Assessment Tax Assessment Total Assessment is a certain percentage of the fair market value that is determined by local assessors to be the total taxable value of land and additions on the property. | Land | Improvement |
|---|---|---|---|---|
| 2024 | $8,834 | $125,615 | $21,072 | $104,543 |
| 2023 | $8,773 | $117,156 | $19,653 | $97,503 |
| 2022 | $8,265 | $103,058 | $17,288 | $85,770 |
| 2021 | $7,851 | $97,151 | $16,297 | $80,854 |
| 2020 | $7,674 | $92,870 | $15,579 | $77,291 |
| 2019 | $7,722 | $91,426 | $15,337 | $76,089 |
| 2018 | $7,878 | $88,600 | $14,863 | $73,737 |
| 2017 | $7,765 | $83,200 | $13,957 | $69,243 |
| 2016 | $7,794 | $79,457 | $13,329 | $66,128 |
| 2013 | -- | $83,572 | $14,208 | $69,364 |
Source: Public Records
Map
Nearby Homes
- 8789 Bentley Ln
- 8610 Steeple Ln
- 8501 Country Shire Ln
- 8303 Appaloosa Ln
- 1914 Spring Dale Dr
- 8300 Appaloosa Ln
- 7822 N Pillow Hill Rd
- 7830 N Pillow Hill Rd
- 9436 Bellaire Ln
- Lot 65 & 66 Main Street Rd
- 10201 Fox Bluff Ln
- Lot 61 Beverly Way
- Lot 57 Beverly Way
- Lot 59 Beverly Way
- Lot 64 Beverly Way
- Lot 60 Beverly Way
- Lot 58 Beverly Way
- LOT 56 Beverly Way
- 2303 Fox Bluff Ln
- 2214 Main Street Rd
- 9305 Nicholas Ln
- 9308 Nicholas Ln
- 9217 Nicholas Ln
- 9311 Nicholas Ln
- 9312 Nicholas Ln
- 9304 Anthony Ln
- 9216 Nicholas Ln
- 9306 Anthony Ln
- 9214 Anthony Ln
- 9209 Nicholas Ln
- 9303 Elizabeth Ln
- 9312 Anthony Ln
- 9317 Nicholas Ln
- 9309 Elizabeth Ln
- 9208 Anthony Ln
- 9318 Nicholas Ln
- 807 Wilmot Farms Dr
- 9208 Nicholas Ln
- 9318 Anthony Ln
- 9317 Elizabeth Ln