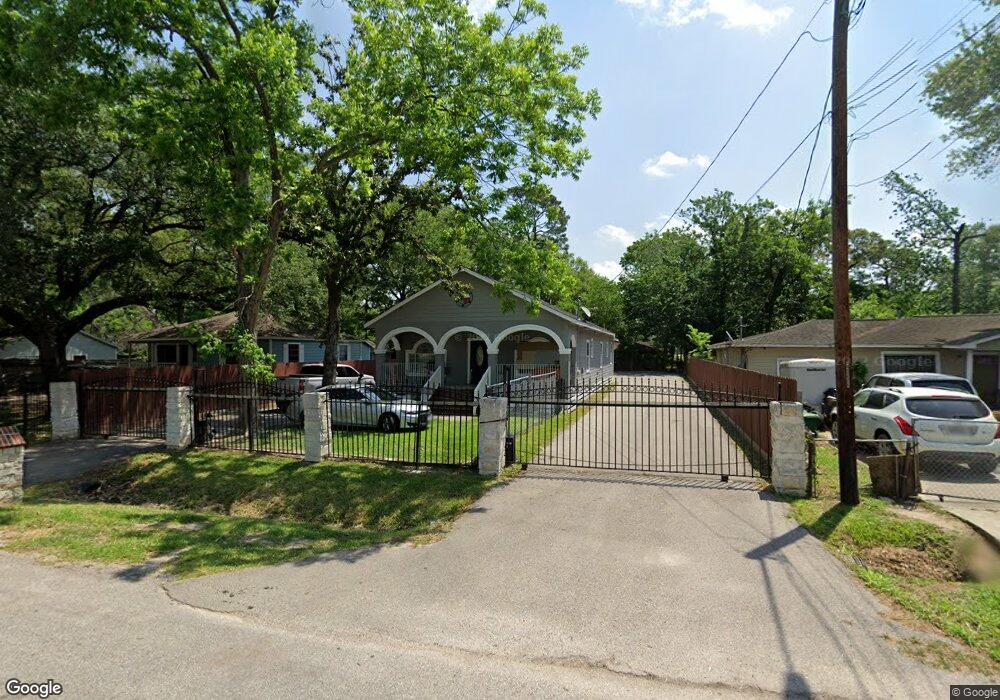
9302 Lanewood Dr Houston, TX 77016
Trinity-Houston Gardens NeighborhoodEstimated Value: $181,000 - $289,000
3
Beds
2
Baths
1,565
Sq Ft
$142/Sq Ft
Est. Value
About This Home
This home is located at 9302 Lanewood Dr, Houston, TX 77016 and is currently estimated at $222,455, approximately $142 per square foot. 9302 Lanewood Dr is a home located in Harris County with nearby schools including Shadydale Elementary School, Forest Brook Middle, and North Forest High School.
Ownership History
Date
Name
Owned For
Owner Type
Purchase Details
Closed on
Mar 4, 2022
Sold by
Hector Valdes
Bought by
Olivera Stephanye
Current Estimated Value
Purchase Details
Closed on
Jan 23, 2018
Sold by
Su Yang and Re Mart Investment
Bought by
Olivera Stephanye
Home Financials for this Owner
Home Financials are based on the most recent Mortgage that was taken out on this home.
Original Mortgage
$21,900
Interest Rate
4.6%
Mortgage Type
Seller Take Back
Purchase Details
Closed on
Nov 15, 2012
Sold by
Texas Pacific Inland Limited Liability C
Bought by
Olivera Stephanie and Valdes Hector
Purchase Details
Closed on
Aug 15, 2006
Sold by
Perlo Development Ii Inc
Bought by
Mike Adams Enterprises and Texas Pacific Inland Llc
Create a Home Valuation Report for This Property
The Home Valuation Report is an in-depth analysis detailing your home's value as well as a comparison with similar homes in the area
Home Values in the Area
Average Home Value in this Area
Purchase History
| Date | Buyer | Sale Price | Title Company |
|---|---|---|---|
| Olivera Stephanye | $45,000 | None Listed On Document | |
| Olivera Stephanye | -- | Startex Title Agency Llc | |
| Olivera Stephanie | -- | Title Houston | |
| Mike Adams Enterprises | -- | Southern American Title |
Source: Public Records
Mortgage History
| Date | Status | Borrower | Loan Amount |
|---|---|---|---|
| Previous Owner | Olivera Stephanye | $21,900 |
Source: Public Records
Tax History Compared to Growth
Tax History
| Year | Tax Paid | Tax Assessment Tax Assessment Total Assessment is a certain percentage of the fair market value that is determined by local assessors to be the total taxable value of land and additions on the property. | Land | Improvement |
|---|---|---|---|---|
| 2025 | $4,307 | $204,986 | $51,795 | $153,191 |
| 2024 | $4,307 | $205,845 | $51,795 | $154,050 |
| 2023 | $4,307 | $205,845 | $38,846 | $166,999 |
| 2022 | $3,486 | $158,300 | $25,898 | $132,402 |
| 2021 | $3,076 | $131,988 | $17,265 | $114,723 |
| 2020 | $2,841 | $117,316 | $17,265 | $100,051 |
| 2019 | $2,253 | $89,048 | $13,812 | $75,236 |
| 2018 | $1,700 | $67,185 | $13,812 | $53,373 |
| 2017 | $1,699 | $67,185 | $13,812 | $53,373 |
| 2016 | $985 | $38,968 | $10,791 | $28,177 |
| 2015 | $255 | $21,134 | $9,927 | $11,207 |
| 2014 | $255 | $9,927 | $9,927 | $0 |
Source: Public Records
Map
Nearby Homes
- 9227 Homestead Rd
- 9317 Homestead Rd
- 5009 Tidwell Rd
- 6110 Tidwell Rd
- 9205 & 9207 Spaulding St
- 9009 Compton St
- 8914 Lanewood Dr
- 6226 E Tidwell Rd
- 8928 Homestead Rd
- 8504 Shady Dr
- 9316 Sundown Dr
- 6206 Antha St
- 6415 Laura Koppe Rd
- 6513 Laura Koppe Rd
- 9603 Homestead Rd
- 9412 Crofton St
- 0 Crofton St
- 9603 Bertwood St
- 9412 Firnat St Unit A-B
- 6320 Laura Koppe Rd
- 9306 Lanewood Dr
- 9226 Lanewood Dr
- 9312 Lanewood Dr
- 9307 Spaulding St
- 9311 Spaulding St
- 9221 Spaulding St
- 9314 Lanewood Dr
- 9315 Spaulding St
- 9215 Spaulding St
- 9214 Lanewood Dr
- 9311 Lanewood Dr
- 9217 Lanewood Dr
- 9322 Lanewood Dr
- 9213 Spaulding St
- 9403 Spaulding St
- 9212 Lanewood Dr
- 9215 Lanewood Dr
- 9321 Lanewood Dr
- 9209 Spaulding St
- 9206 Lanewood Dr