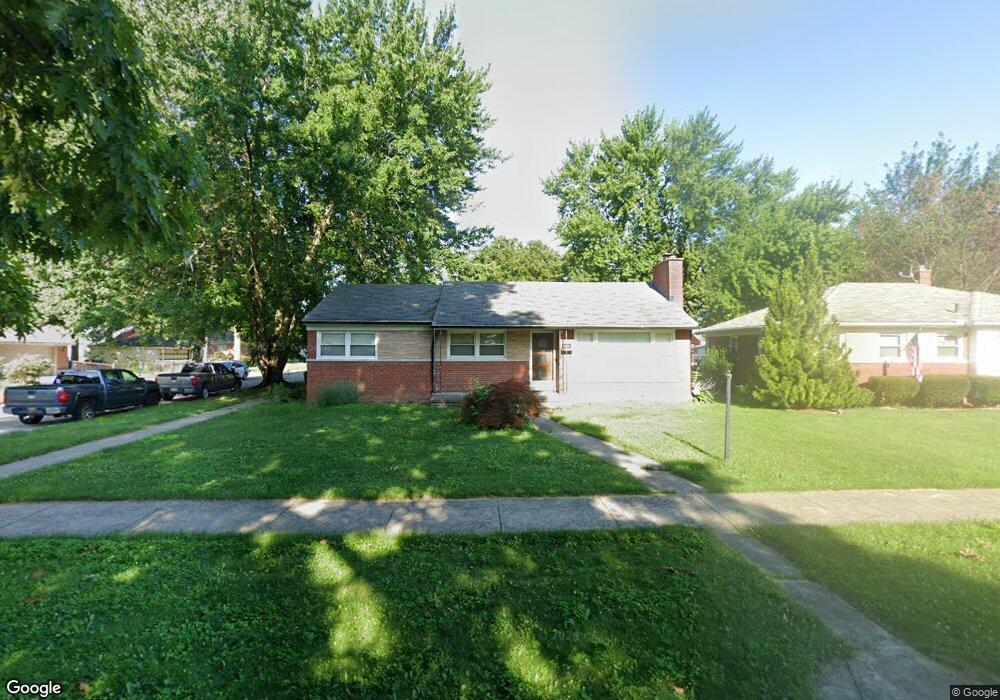
9305 Tecumseh Redford, MI 48239
Estimated Value: $217,000 - $279,000
Studio
1
Bath
1,196
Sq Ft
$199/Sq Ft
Est. Value
About This Home
This home is located at 9305 Tecumseh, Redford, MI 48239 and is currently estimated at $237,474, approximately $198 per square foot. 9305 Tecumseh is a home located in Wayne County with nearby schools including John D. Pierce Middle School, Lee M. Thurston High School, and Westfield Charter Academy.
Ownership History
Date
Name
Owned For
Owner Type
Purchase Details
Closed on
Jul 3, 2024
Sold by
Frank J Barkman J and Frank Billie G
Bought by
Longsdorf Ronald Leon
Current Estimated Value
Purchase Details
Closed on
Jan 6, 2011
Sold by
Barkman Frank J and Barkman Billie G
Bought by
Joint Frank J Barkman and Joint Billie G Barkman
Purchase Details
Closed on
May 14, 2008
Sold by
Foltz Daniel and Foltz Erin
Bought by
Barkman Frank J
Purchase Details
Closed on
Nov 15, 1999
Sold by
Woodrow Hugh B
Bought by
Foltz Daniel
Create a Home Valuation Report for This Property
The Home Valuation Report is an in-depth analysis detailing your home's value as well as a comparison with similar homes in the area
Home Values in the Area
Average Home Value in this Area
Purchase History
| Date | Buyer | Sale Price | Title Company |
|---|---|---|---|
| Longsdorf Ronald Leon | $75,000 | None Listed On Document | |
| Joint Frank J Barkman | -- | None Available | |
| Barkman Frank J | $147,000 | Metropolitan Title Company | |
| Foltz Daniel | $133,000 | -- |
Source: Public Records
Tax History
| Year | Tax Paid | Tax Assessment Tax Assessment Total Assessment is a certain percentage of the fair market value that is determined by local assessors to be the total taxable value of land and additions on the property. | Land | Improvement |
|---|---|---|---|---|
| 2025 | $1,361 | $109,400 | $0 | $0 |
| 2024 | $1,324 | $102,500 | $0 | $0 |
| 2023 | $1,268 | $90,200 | $0 | $0 |
| 2022 | $3,587 | $80,500 | $0 | $0 |
| 2021 | $3,485 | $76,500 | $0 | $0 |
| 2020 | $3,897 | $68,600 | $0 | $0 |
| 2019 | $3,360 | $60,200 | $0 | $0 |
| 2018 | $1,141 | $50,700 | $0 | $0 |
| 2017 | $3,948 | $47,900 | $0 | $0 |
| 2016 | $2,141 | $43,100 | $0 | $0 |
| 2015 | $3,334 | $38,400 | $0 | $0 |
| 2013 | $3,230 | $33,000 | $0 | $0 |
| 2012 | $3,376 | $35,800 | $7,900 | $27,900 |
Source: Public Records
Map
Nearby Homes
- 9101 Sioux
- 9010 Leverne
- 26740 Joy Rd Unit 8
- 26760 Joy Rd Unit E8
- 26710 Joy Rd Unit A
- 26710 Joy Rd Unit A, 10
- 9624 Nathaline
- 8915 Sioux
- 26790 Joy Rd Unit 7
- 9540 Mercedes
- 9130 Kinloch
- 27007 Joy Rd
- 9619 Mercedes
- 9983 Hemingway
- 26030 W Chicago
- 11385 Leverne
- 26923 Constance St
- 9114 Cardwell St
- 11417 Leverne
- 11377 Sioux
Your Personal Tour Guide
Ask me questions while you tour the home.