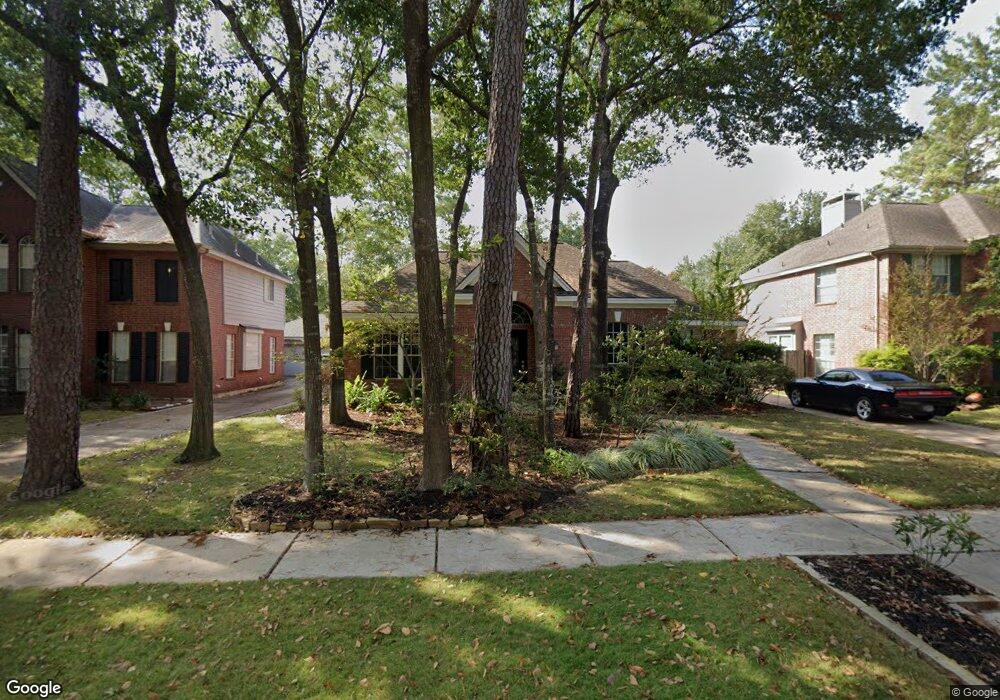
9307 Woodwind Lakes Dr Houston, TX 77040
Brookhollow West NeighborhoodEstimated Value: $361,000 - $419,000
4
Beds
3
Baths
2,402
Sq Ft
$163/Sq Ft
Est. Value
About This Home
This home is located at 9307 Woodwind Lakes Dr, Houston, TX 77040 and is currently estimated at $392,358, approximately $163 per square foot. 9307 Woodwind Lakes Dr is a home located in Harris County with nearby schools including Gleason Elementary School, Cook Middle School, and Jersey Village High School.
Ownership History
Date
Name
Owned For
Owner Type
Purchase Details
Closed on
Feb 28, 2002
Sold by
Flock Kelly and Flock Kerry Brennan
Bought by
Dunn Warren B
Current Estimated Value
Home Financials for this Owner
Home Financials are based on the most recent Mortgage that was taken out on this home.
Original Mortgage
$162,000
Outstanding Balance
$67,052
Interest Rate
6.93%
Estimated Equity
$325,306
Purchase Details
Closed on
Mar 16, 2000
Sold by
Hubbell James T and Brockman Diana
Bought by
Flock Kelly
Home Financials for this Owner
Home Financials are based on the most recent Mortgage that was taken out on this home.
Original Mortgage
$158,400
Interest Rate
7.62%
Purchase Details
Closed on
Apr 1, 1996
Sold by
Kelly Thomas D and Kelly Janelle L Derickson
Bought by
Hubbell James T
Home Financials for this Owner
Home Financials are based on the most recent Mortgage that was taken out on this home.
Original Mortgage
$156,000
Interest Rate
7.8%
Create a Home Valuation Report for This Property
The Home Valuation Report is an in-depth analysis detailing your home's value as well as a comparison with similar homes in the area
Home Values in the Area
Average Home Value in this Area
Purchase History
| Date | Buyer | Sale Price | Title Company |
|---|---|---|---|
| Dunn Warren B | -- | Stewart Title | |
| Flock Kelly | -- | Charter Title Company | |
| Hubbell James T | -- | Heritage Title Company |
Source: Public Records
Mortgage History
| Date | Status | Borrower | Loan Amount |
|---|---|---|---|
| Open | Dunn Warren B | $162,000 | |
| Previous Owner | Flock Kelly | $158,400 | |
| Previous Owner | Hubbell James T | $156,000 | |
| Closed | Dunn Warren B | $10,125 |
Source: Public Records
Tax History Compared to Growth
Tax History
| Year | Tax Paid | Tax Assessment Tax Assessment Total Assessment is a certain percentage of the fair market value that is determined by local assessors to be the total taxable value of land and additions on the property. | Land | Improvement |
|---|---|---|---|---|
| 2025 | $5,894 | $346,790 | $75,871 | $270,919 |
| 2024 | $5,894 | $368,688 | $75,871 | $292,817 |
| 2023 | $5,894 | $359,910 | $75,871 | $284,039 |
| 2022 | $7,417 | $326,107 | $58,305 | $267,802 |
| 2021 | $7,075 | $273,063 | $58,305 | $214,758 |
| 2020 | $7,457 | $280,955 | $48,588 | $232,367 |
| 2019 | $7,813 | $285,611 | $48,588 | $237,023 |
| 2018 | $2,865 | $279,985 | $48,588 | $231,397 |
| 2017 | $7,661 | $279,985 | $48,588 | $231,397 |
| 2016 | $7,249 | $279,985 | $48,588 | $231,397 |
| 2015 | $5,002 | $279,985 | $48,588 | $231,397 |
| 2014 | $5,002 | $236,072 | $37,375 | $198,697 |
Source: Public Records
Map
Nearby Homes
- 9315 Woodwind Lakes Dr
- 9114 Brahms Ln
- 9118 Woodwind Lakes Dr
- 7714 Rolling Fork Ln
- 8302 Country Wind Ln
- 8315 Terrace Wind Dr
- 7947 Clarion Way
- 8227 Prairie Wind Ln
- 9430 Oratorio Ct
- 8026 Clarion Way
- 7926 Stoneyway Dr
- 7824 Stoneyway Dr
- 7818 Stoneyway Dr
- 7903 Bachwood Dr
- 8111 Ivan Reid Dr
- 9427 Fern Wood Forest
- 8126 Ivan Reid Dr
- 7926 Windy Creek Dr
- 8359 Shadow Wind Dr
- 8502 Laurel Trace
- 9311 Woodwind Lakes Dr
- 9303 Woodwind Lakes Dr
- 8006 Sonata Ct
- 8006 Sonata Ct
- 8010 Sonata Ct
- 8010 Sonata Ct
- 0 Sonata Ct Unit 53169958
- 8027 Ensemble Dr
- 8014 Sonata Ct
- 8014 Sonata Ct
- 9319 Woodwind Lakes Dr
- 8023 Ensemble Dr
- 9219 Woodwind Lakes Dr
- 8018 Sonata Ct
- 9323 Woodwind Lakes Dr
- 7918 Sonata Ct
- 8026 Ensemble Dr
- 8019 Ensemble Dr
- 8011 Sonata Ct
- 8003 Sonata Ct