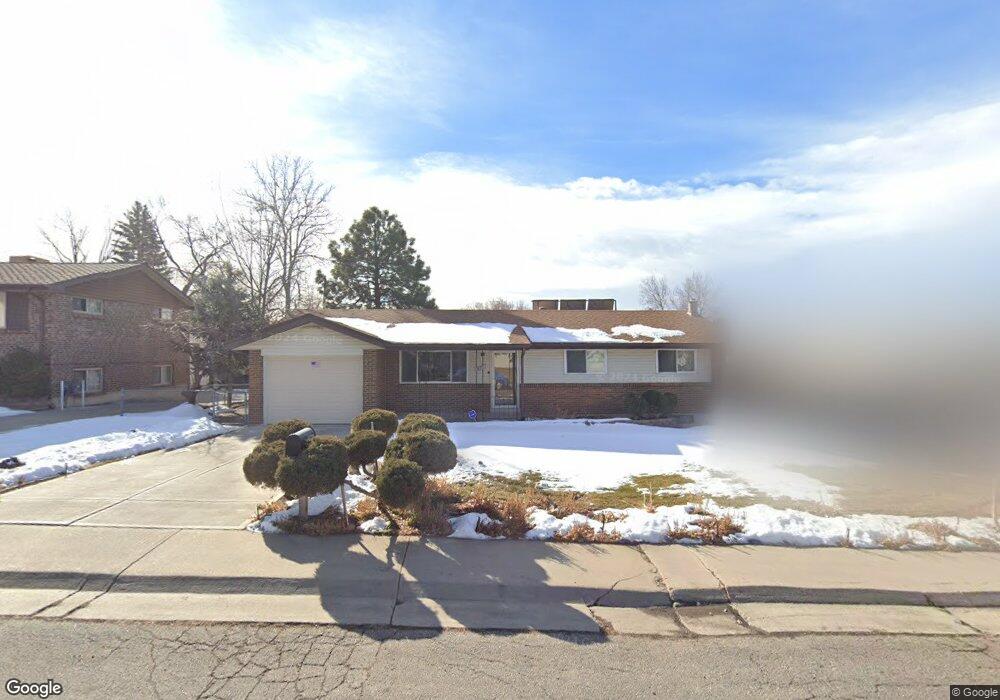
9308 W 67th Ave Arvada, CO 80004
Scenic Heights NeighborhoodEstimated Value: $545,115 - $661,000
3
Beds
1
Bath
1,007
Sq Ft
$595/Sq Ft
Est. Value
About This Home
This home is located at 9308 W 67th Ave, Arvada, CO 80004 and is currently estimated at $598,779, approximately $594 per square foot. 9308 W 67th Ave is a home located in Jefferson County with nearby schools including Secrest Elementary School, Peck Elementary School, and Arvada K-8.
Ownership History
Date
Name
Owned For
Owner Type
Purchase Details
Closed on
Oct 23, 2013
Sold by
Camblin Family Trust and Camblin Charles Thomas
Bought by
Camblin Family Trust
Current Estimated Value
Home Financials for this Owner
Home Financials are based on the most recent Mortgage that was taken out on this home.
Original Mortgage
$32,000
Interest Rate
5.74%
Mortgage Type
Purchase Money Mortgage
Purchase Details
Closed on
Nov 27, 2000
Sold by
Camblin Charles T Camblin Linda J
Bought by
Camblin Charles Thomas and Camblin Linda Jo
Create a Home Valuation Report for This Property
The Home Valuation Report is an in-depth analysis detailing your home's value as well as a comparison with similar homes in the area
Home Values in the Area
Average Home Value in this Area
Purchase History
| Date | Buyer | Sale Price | Title Company |
|---|---|---|---|
| Camblin Family Trust | -- | None Available | |
| Camblin Charles Thomas | -- | -- |
Source: Public Records
Mortgage History
| Date | Status | Borrower | Loan Amount |
|---|---|---|---|
| Closed | Camblin Family Trust | $32,000 |
Source: Public Records
Tax History Compared to Growth
Tax History
| Year | Tax Paid | Tax Assessment Tax Assessment Total Assessment is a certain percentage of the fair market value that is determined by local assessors to be the total taxable value of land and additions on the property. | Land | Improvement |
|---|---|---|---|---|
| 2024 | $2,508 | $32,555 | $16,509 | $16,046 |
| 2023 | $2,508 | $32,555 | $16,509 | $16,046 |
| 2022 | $2,059 | $27,975 | $13,115 | $14,860 |
| 2021 | $2,093 | $28,780 | $13,492 | $15,288 |
| 2020 | $1,701 | $24,773 | $10,790 | $13,983 |
| 2019 | $1,678 | $24,773 | $10,790 | $13,983 |
| 2018 | $1,493 | $22,452 | $7,751 | $14,701 |
| 2017 | $1,367 | $22,452 | $7,751 | $14,701 |
| 2016 | $957 | $18,020 | $5,117 | $12,903 |
| 2015 | $739 | $18,020 | $5,117 | $12,903 |
| 2014 | $739 | $14,597 | $4,384 | $10,213 |
Source: Public Records
Map
Nearby Homes
- 6750 Garrison St
- 9173 W 66th Place
- 6842 Garland St
- 9743 W 67th Place
- 6580 Independence Way
- 6455 Field St
- 9642 W 69th Place
- 6572 Kipling St
- 6532 Kipling St
- 6734 Kline St
- 9656 Rensselaer Dr
- 8612 W 69th Place
- 6250 Everett Ct Unit E
- 6240 Everett Ct Unit F
- 9175 Cole Dr
- 9667 W 63rd Ave
- 6801 Carr St
- 10171 W 69th Ave
- 9636 W 71st Place
- 6200 Estes St
- 9328 W 67th Ave
- 9268 W 67th Ave
- 9303 W 66th Place
- 9273 W 66th Place
- 9317 W 66th Place
- 9338 W 67th Ave
- 6713 Garland St
- 9248 W 67th Ave
- 9327 W 66th Place
- 9357 W 67th Ave
- 9243 W 66th Place
- 9348 W 67th Ave
- 6712 Garland St
- 9238 W 67th Ave
- 6733 Garland St
- 9337 W 66th Place
- 6724 Garland St
- 9304 W 66th Place
- 9314 W 66th Place
- 9274 W 66th Place