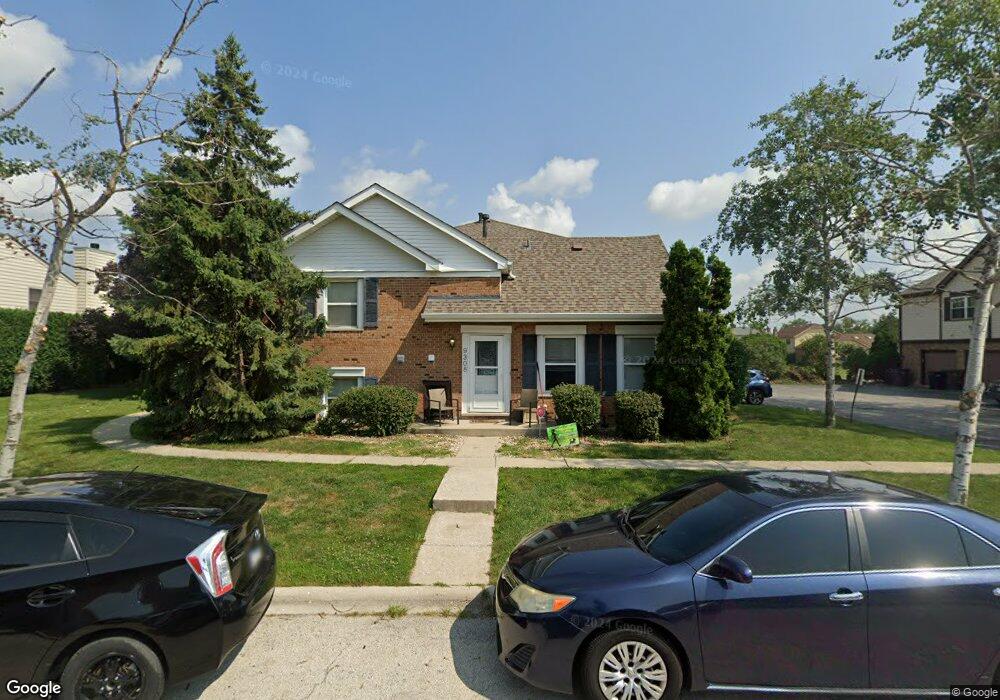
9308 Wherry Ln Unit 6 Orland Park, IL 60462
Central Orland NeighborhoodEstimated Value: $256,730 - $286,000
2
Beds
2
Baths
1,500
Sq Ft
$183/Sq Ft
Est. Value
About This Home
This home is located at 9308 Wherry Ln Unit 6, Orland Park, IL 60462 and is currently estimated at $274,433, approximately $182 per square foot. 9308 Wherry Ln Unit 6 is a home located in Cook County with nearby schools including Orland Center School, Liberty Elementary School, and Jerling Junior High School.
Ownership History
Date
Name
Owned For
Owner Type
Purchase Details
Closed on
Aug 21, 2009
Sold by
Girdick Joshua A
Bought by
Oehmen Mark A and Oehmen Gloria J
Current Estimated Value
Home Financials for this Owner
Home Financials are based on the most recent Mortgage that was taken out on this home.
Original Mortgage
$183,612
Outstanding Balance
$120,143
Interest Rate
5.28%
Mortgage Type
FHA
Estimated Equity
$154,290
Purchase Details
Closed on
Jul 21, 2006
Sold by
Shepherd Paul
Bought by
Girdick Joshua A
Home Financials for this Owner
Home Financials are based on the most recent Mortgage that was taken out on this home.
Original Mortgage
$190,018
Interest Rate
6.82%
Mortgage Type
FHA
Purchase Details
Closed on
Nov 2, 1996
Sold by
Austin David H
Bought by
Shepherd Paul
Home Financials for this Owner
Home Financials are based on the most recent Mortgage that was taken out on this home.
Original Mortgage
$117,850
Interest Rate
7.64%
Mortgage Type
FHA
Create a Home Valuation Report for This Property
The Home Valuation Report is an in-depth analysis detailing your home's value as well as a comparison with similar homes in the area
Home Values in the Area
Average Home Value in this Area
Purchase History
| Date | Buyer | Sale Price | Title Company |
|---|---|---|---|
| Oehmen Mark A | $187,000 | Multiple | |
| Girdick Joshua A | $193,000 | Multiple | |
| Shepherd Paul | $122,000 | -- |
Source: Public Records
Mortgage History
| Date | Status | Borrower | Loan Amount |
|---|---|---|---|
| Open | Oehmen Mark A | $183,612 | |
| Previous Owner | Girdick Joshua A | $190,018 | |
| Previous Owner | Shepherd Paul | $117,850 |
Source: Public Records
Tax History Compared to Growth
Tax History
| Year | Tax Paid | Tax Assessment Tax Assessment Total Assessment is a certain percentage of the fair market value that is determined by local assessors to be the total taxable value of land and additions on the property. | Land | Improvement |
|---|---|---|---|---|
| 2024 | $5,160 | $20,619 | $2,014 | $18,605 |
| 2023 | $3,861 | $20,619 | $2,014 | $18,605 |
| 2022 | $3,861 | $12,890 | $1,772 | $11,118 |
| 2021 | $3,729 | $12,889 | $1,772 | $11,117 |
| 2020 | $3,589 | $12,889 | $1,772 | $11,117 |
| 2019 | $5,658 | $20,614 | $1,611 | $19,003 |
| 2018 | $5,503 | $20,614 | $1,611 | $19,003 |
| 2017 | $5,379 | $20,614 | $1,611 | $19,003 |
| 2016 | $4,676 | $16,759 | $1,449 | $15,310 |
| 2015 | $4,631 | $16,759 | $1,449 | $15,310 |
| 2014 | $4,563 | $16,759 | $1,449 | $15,310 |
| 2013 | $4,122 | $16,081 | $1,449 | $14,632 |
Source: Public Records
Map
Nearby Homes
- 9314 Wherry Ln Unit D
- 15511 Westminster Dr Unit 65B
- 9209 Cliffside Ln Unit 54C
- 9203 Wheeler Dr
- 9350 Waterford Ln Unit C16
- 9337 Waterford Ln Unit D3
- 9291 Erin Ln Unit D7
- 15336 Regent Dr
- 15324 Regent Dr
- 56 Orland Square Dr
- 15301 Wilshire Dr
- 15963 91st Ave
- 16040 Boardwalk Ln Unit 4A
- 9866 Treetop Dr Unit 7
- 9061 Somerset Ct Unit 16
- 9180 136th St
- 16121 S 94th Ave
- 15726 Orlan Brook Dr Unit 193
- 9411 Albany Ct
- 9225 162nd St
- 9310 Wherry Ln Unit 8
- 9310 Wherry Ln Unit 9310
- 9314 Wherry Ln Unit 5
- 9302 Wherry Ln Unit 4
- 9306 Wherry Ln Unit 1
- 9304 Wherry Ln Unit 3
- 9317 Wheeler Dr Unit 72C
- 9317 Wheeler Dr Unit C
- 9316 Wherry Ln Unit 72B
- 9300 Wherry Ln Unit 2
- 9320 Wherry Ln Unit 72A
- 9321 Wherry Ln Unit 69C
- 9321 Wheeler Dr Unit 72D
- 15511 Whitehall Ln Unit 69A
- 15502 Whitehall Ln Unit 71D
- 15513 Whitehall Ln Unit 69B
- 9310 Wheeler Dr
- 15504 Whitehall Ln Unit 71C
- 15504 Westminster Dr Unit 66D
- 15504 Westminster Dr Unit D