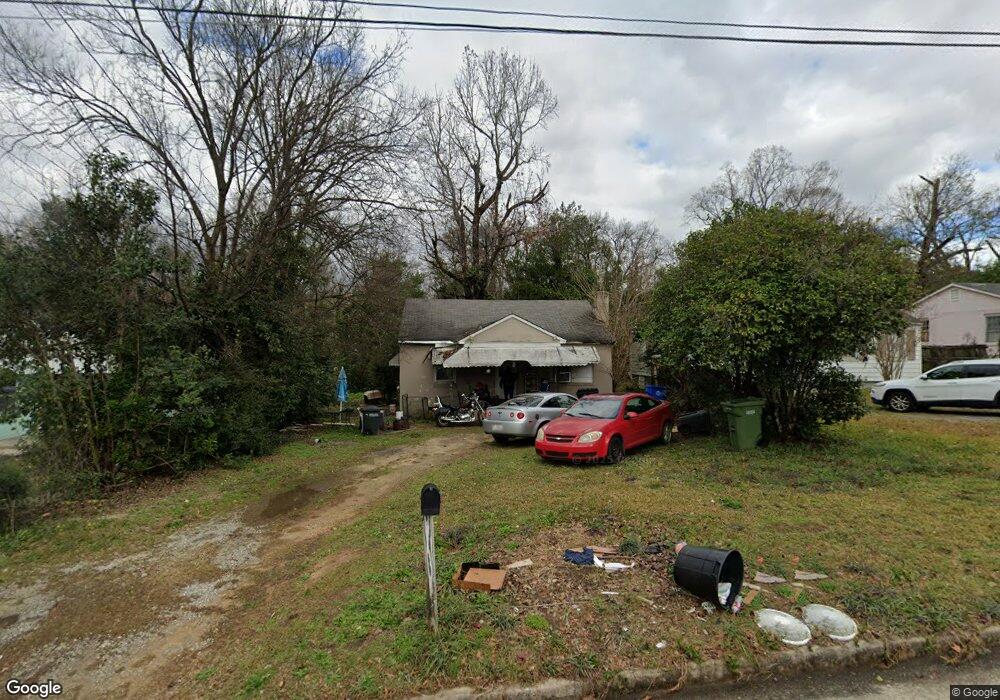
931 39th St Columbus, GA 31904
North Highlands NeighborhoodEstimated Value: $50,000 - $142,000
2
Beds
2
Baths
783
Sq Ft
$104/Sq Ft
Est. Value
About This Home
This home is located at 931 39th St, Columbus, GA 31904 and is currently estimated at $81,251, approximately $103 per square foot. 931 39th St is a home located in Muscogee County with nearby schools including Johnson Elementary School, Arnold Middle School, and Jordan Vocational High School.
Ownership History
Date
Name
Owned For
Owner Type
Purchase Details
Closed on
Sep 16, 2021
Sold by
Impecunious Investors Llc
Bought by
Bibb Realty Co Llc
Current Estimated Value
Home Financials for this Owner
Home Financials are based on the most recent Mortgage that was taken out on this home.
Original Mortgage
$55,000
Outstanding Balance
$3,419
Interest Rate
2.8%
Mortgage Type
Commercial
Estimated Equity
$77,832
Purchase Details
Closed on
Mar 20, 2015
Sold by
Tindall Percy B
Bought by
Impecunious Investors Llc
Create a Home Valuation Report for This Property
The Home Valuation Report is an in-depth analysis detailing your home's value as well as a comparison with similar homes in the area
Home Values in the Area
Average Home Value in this Area
Purchase History
| Date | Buyer | Sale Price | Title Company |
|---|---|---|---|
| Bibb Realty Co Llc | -- | -- | |
| Impecunious Investors Llc | -- | Rhodes & Warner Pc | |
| Impecunious Investors Llc | $76,000 | -- |
Source: Public Records
Mortgage History
| Date | Status | Borrower | Loan Amount |
|---|---|---|---|
| Open | Impecunious Investors Llc | $55,000 | |
| Closed | Bibb Realty Co Llc | $55,000 |
Source: Public Records
Tax History Compared to Growth
Tax History
| Year | Tax Paid | Tax Assessment Tax Assessment Total Assessment is a certain percentage of the fair market value that is determined by local assessors to be the total taxable value of land and additions on the property. | Land | Improvement |
|---|---|---|---|---|
| 2025 | $620 | $15,840 | $5,692 | $10,148 |
| 2024 | $620 | $15,840 | $5,692 | $10,148 |
| 2023 | $457 | $15,840 | $5,692 | $10,148 |
| 2022 | $474 | $11,604 | $3,984 | $7,620 |
| 2021 | $324 | $7,860 | $3,984 | $3,876 |
| 2020 | $321 | $7,860 | $3,984 | $3,876 |
| 2019 | $343 | $8,360 | $2,508 | $5,852 |
| 2018 | $343 | $8,360 | $2,508 | $5,852 |
| 2017 | $425 | $8,360 | $2,508 | $5,852 |
| 2016 | $56 | $1,360 | $394 | $966 |
| 2015 | $116 | $7,037 | $2,036 | $5,001 |
| 2014 | $116 | $7,037 | $2,036 | $5,001 |
| 2013 | -- | $7,037 | $2,036 | $5,001 |
Source: Public Records
Map
Nearby Homes